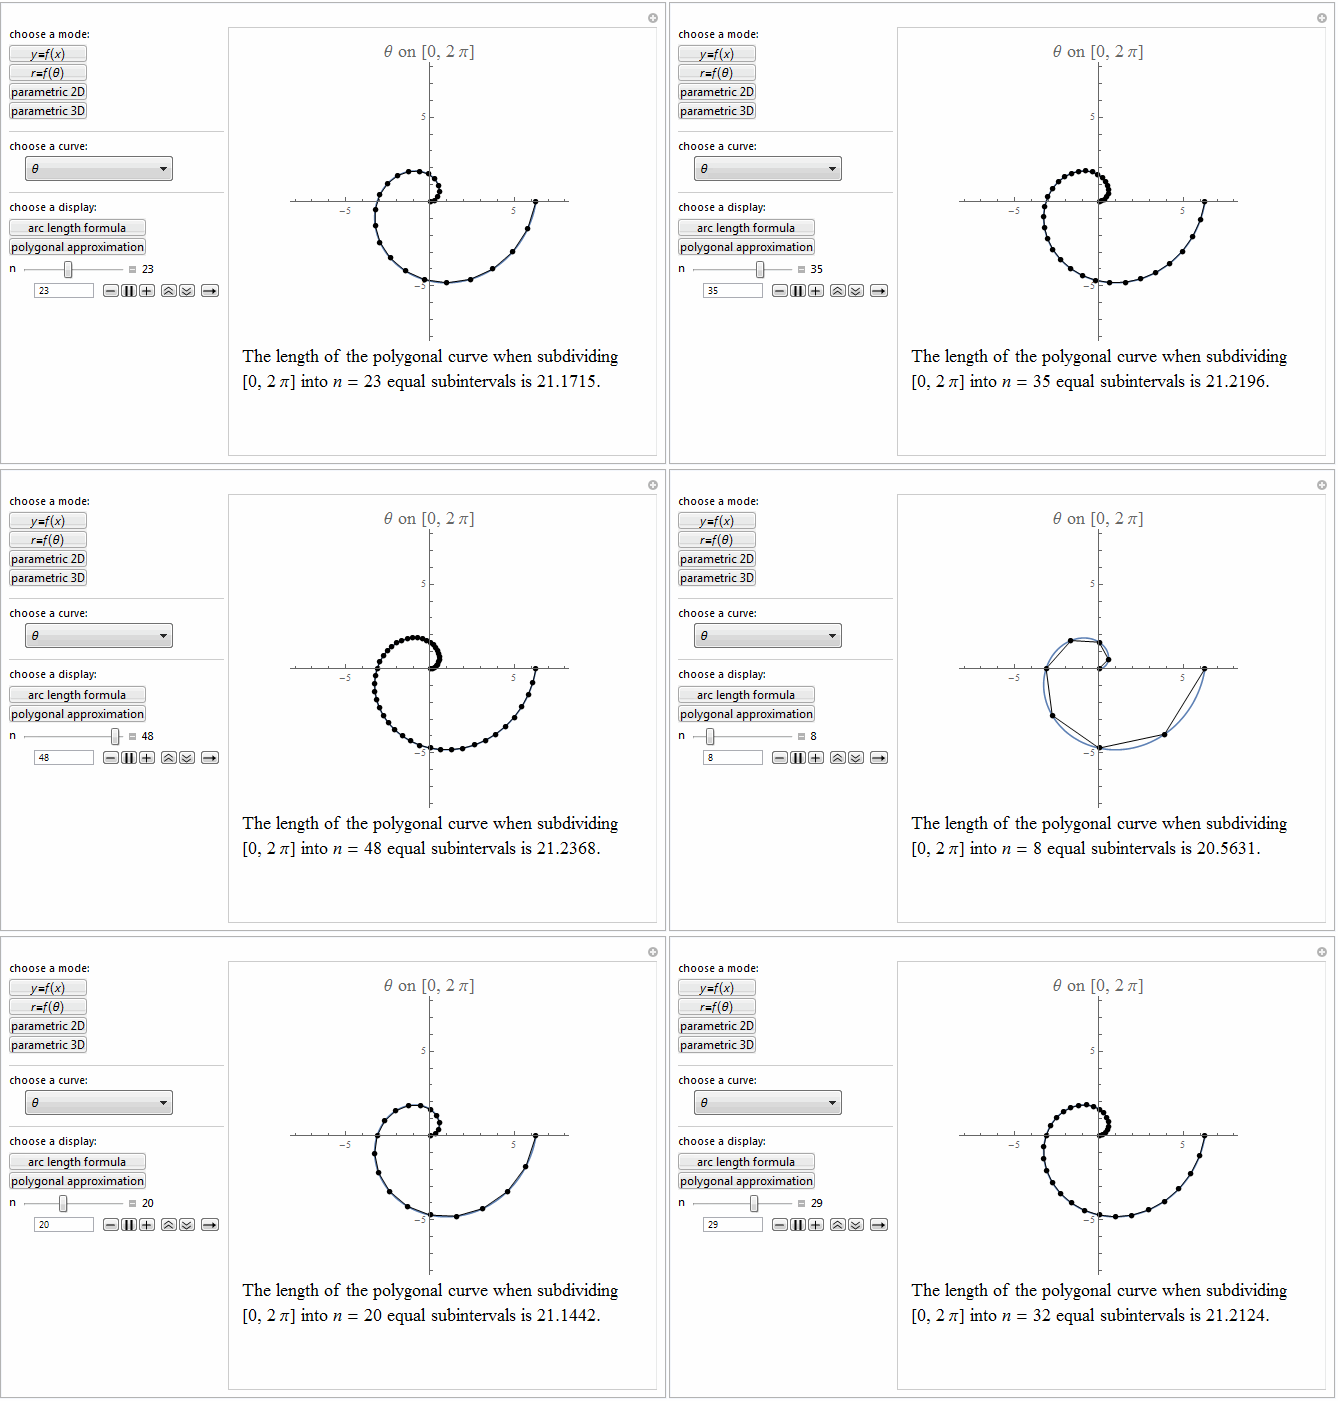 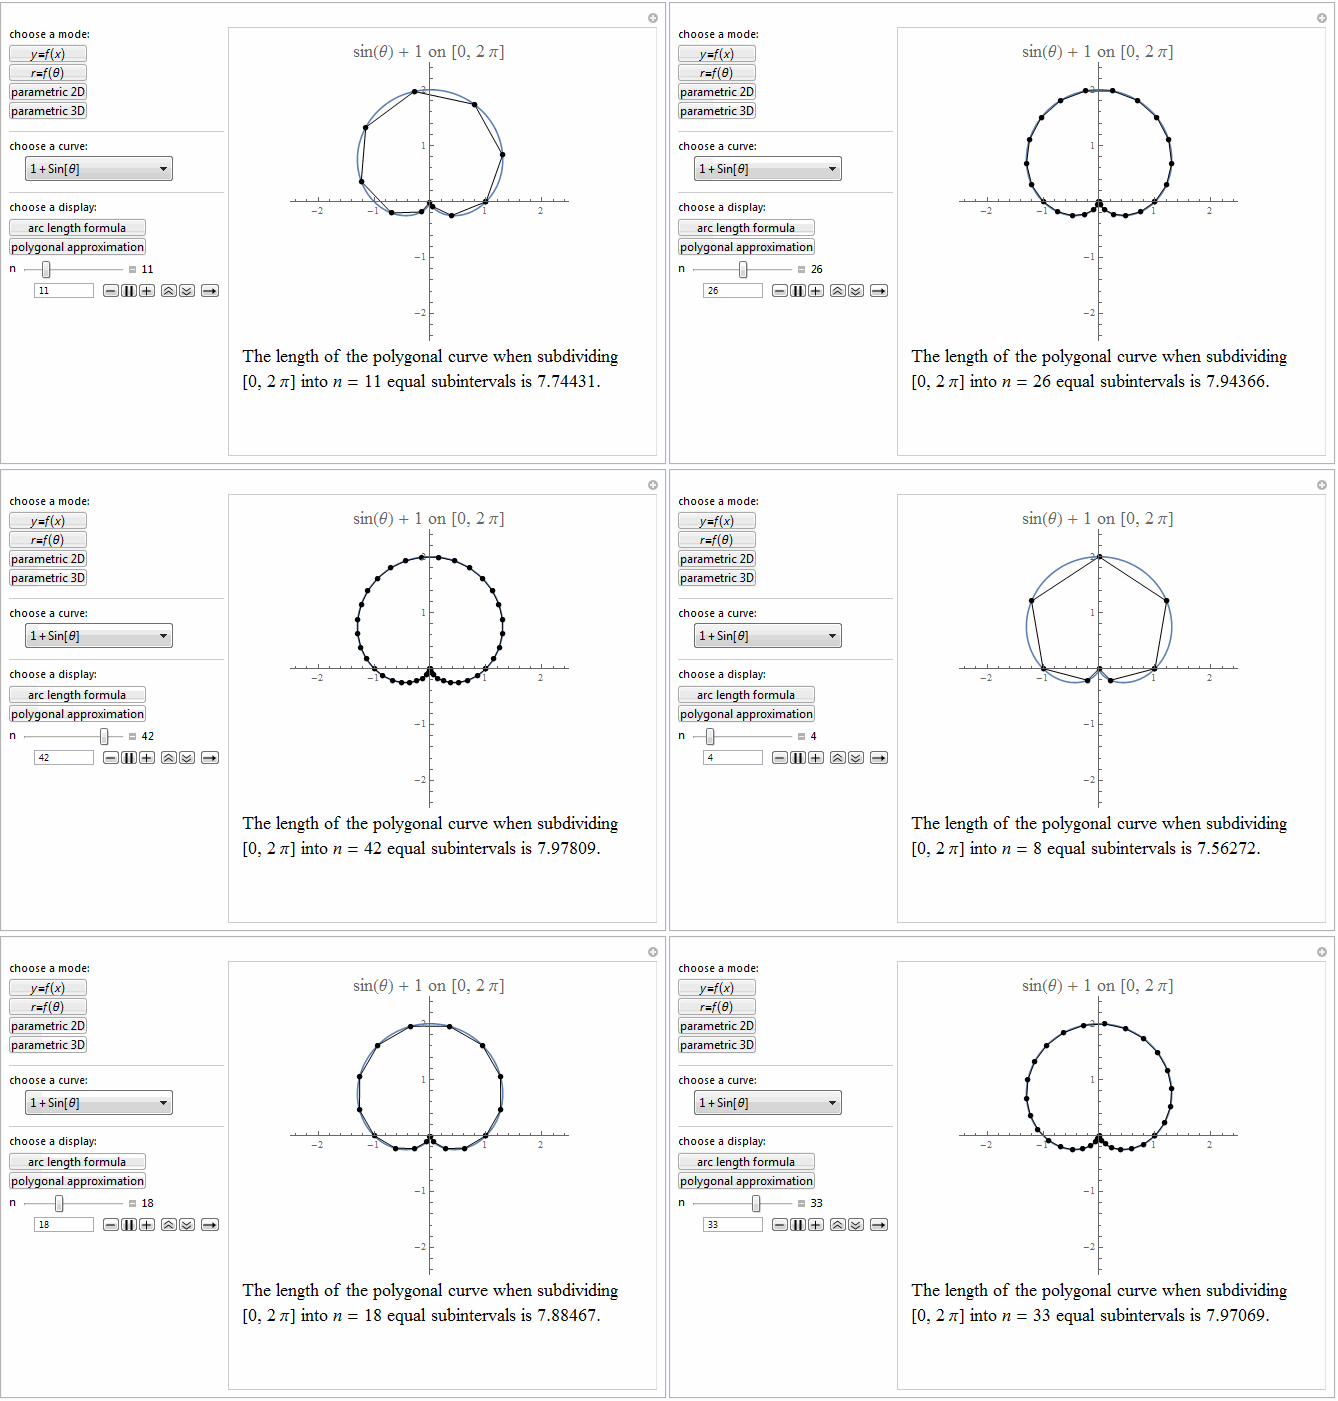
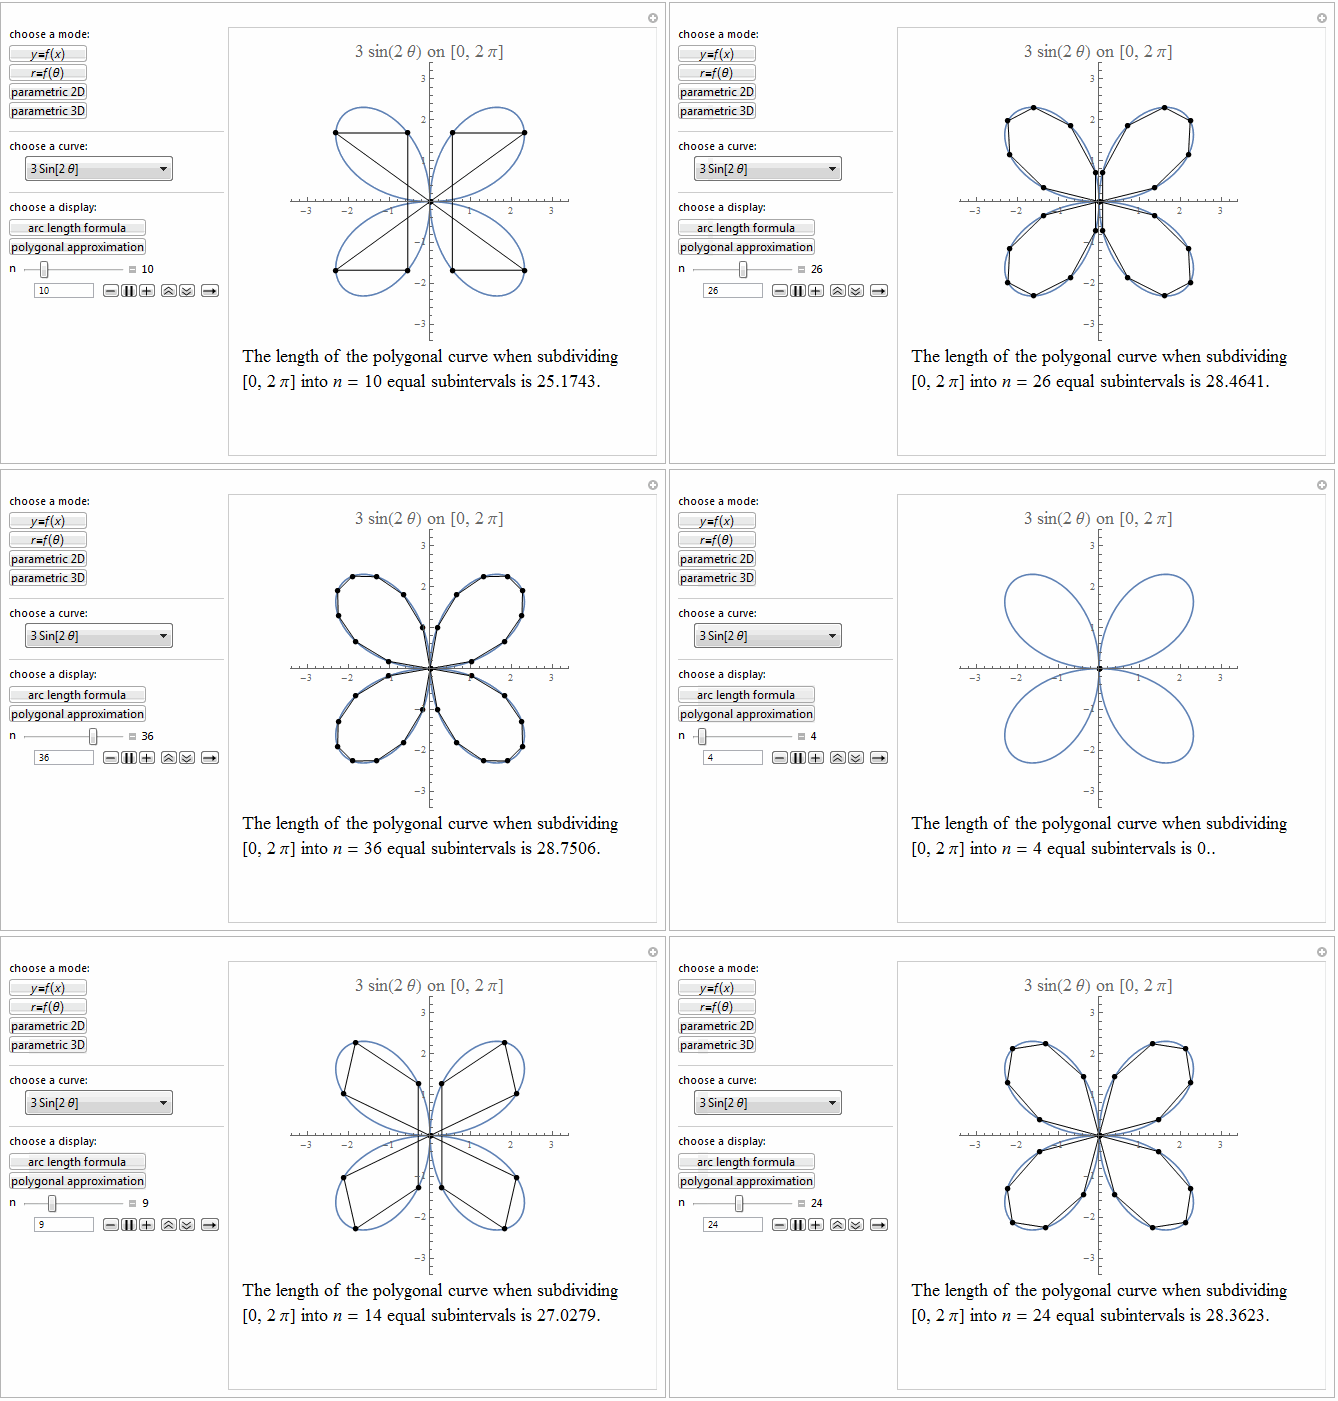
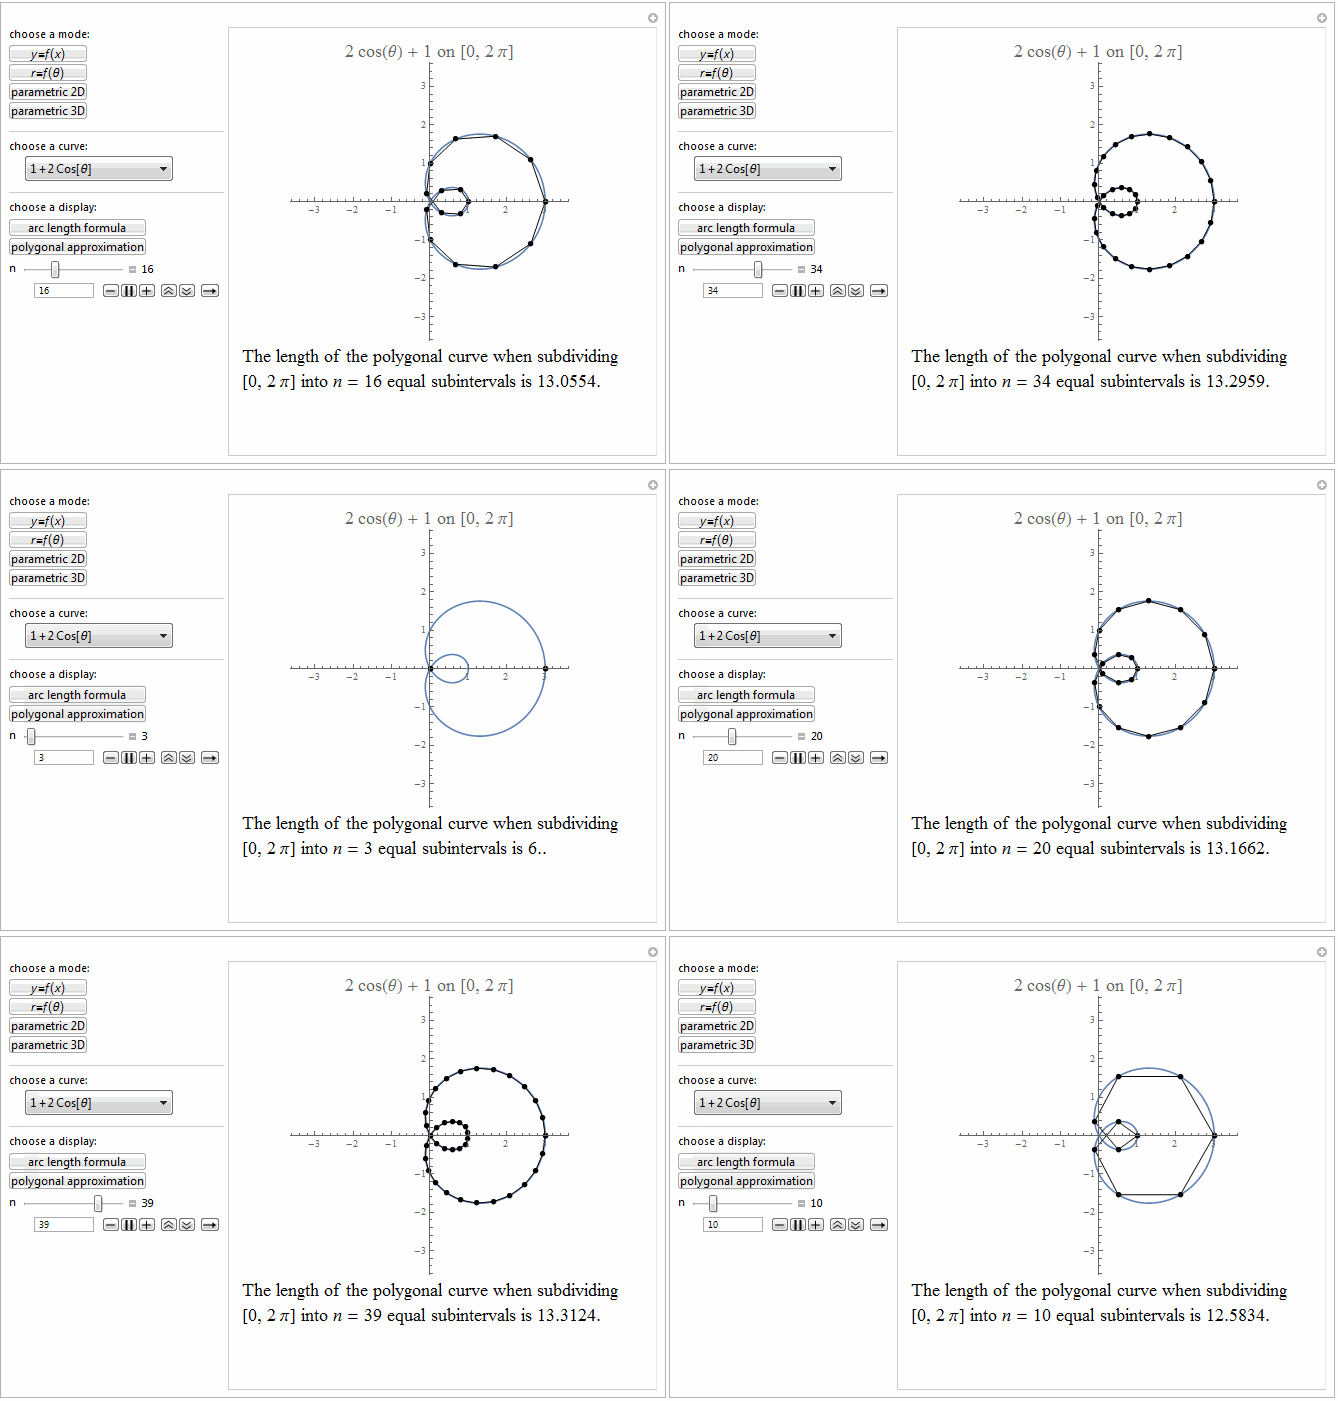
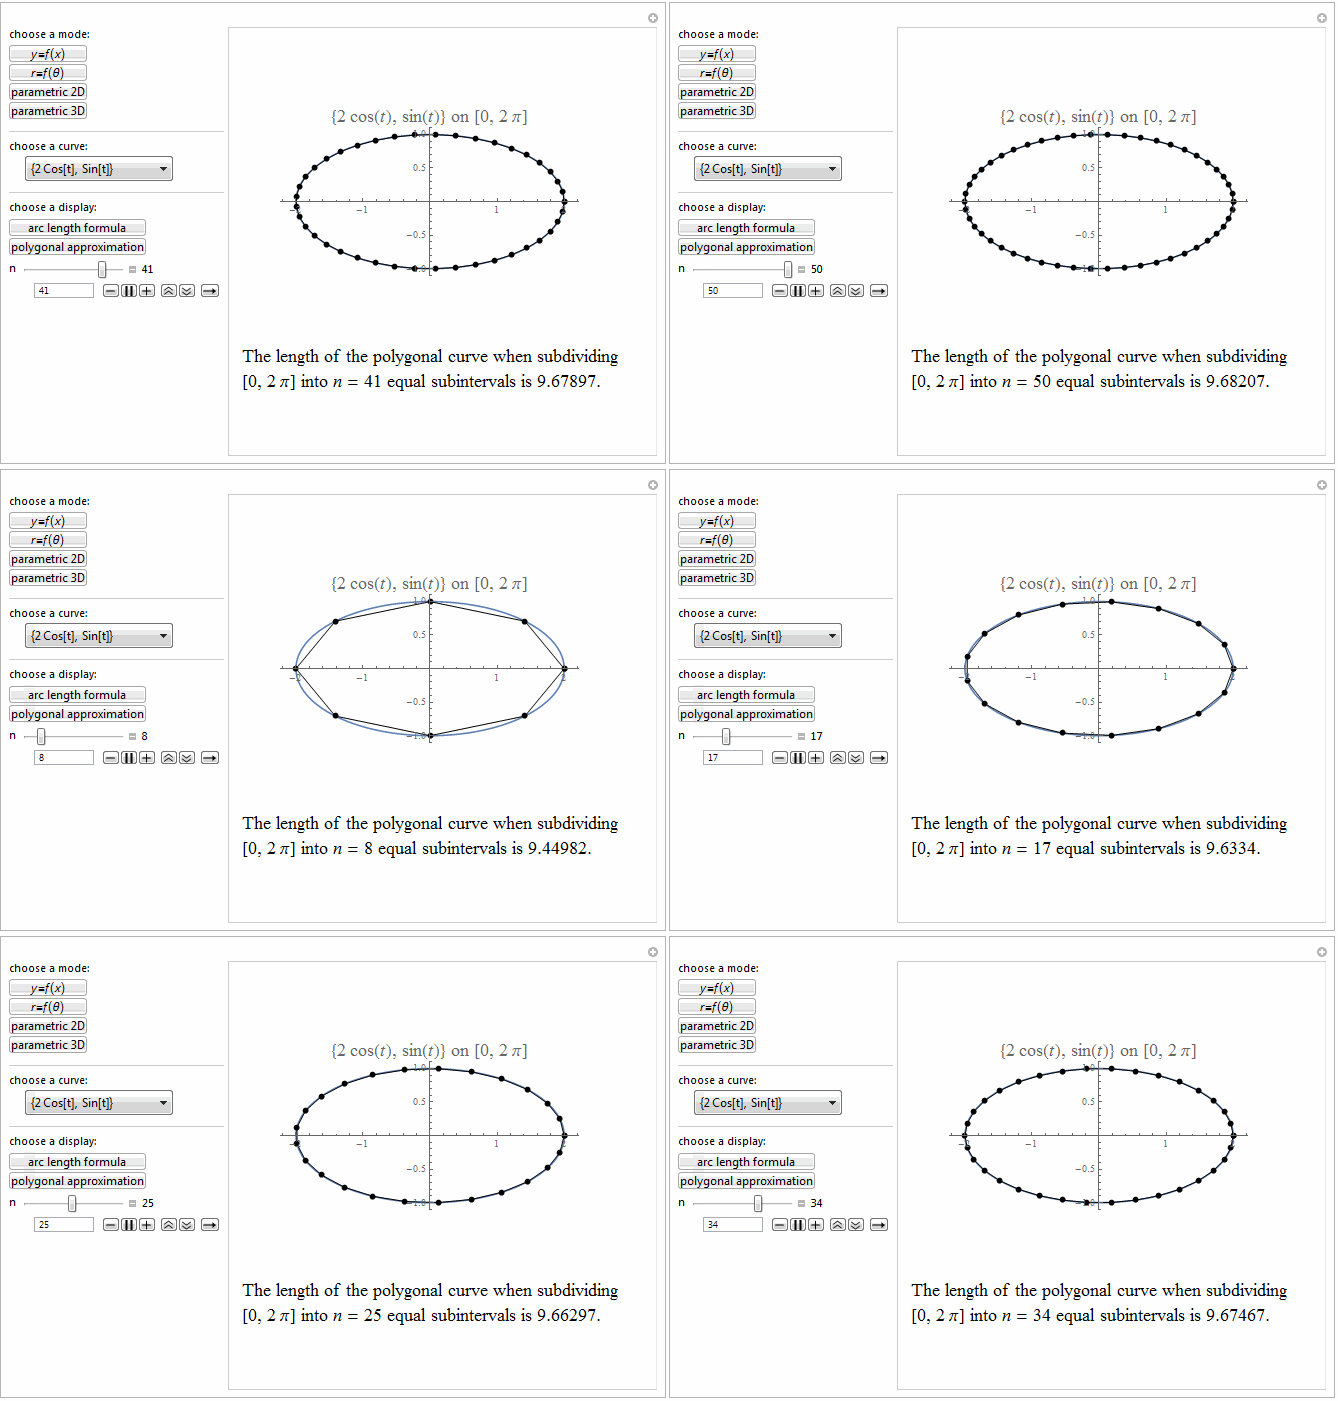
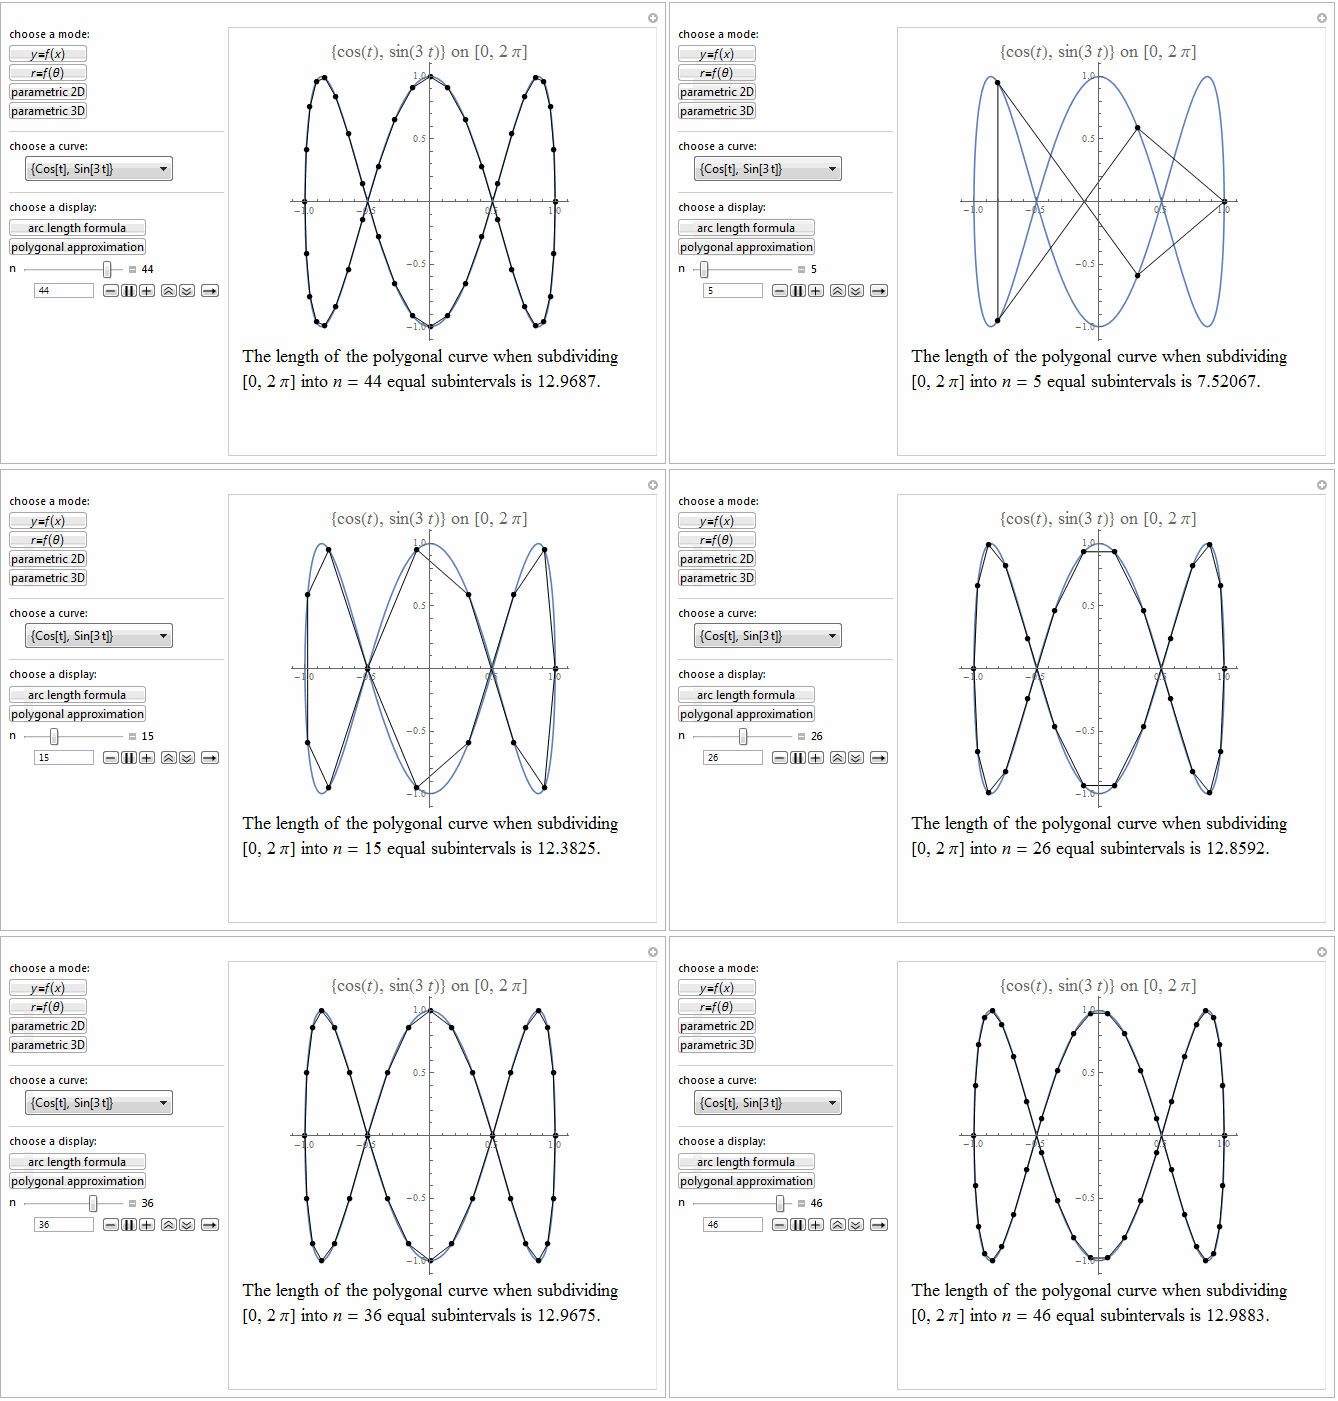
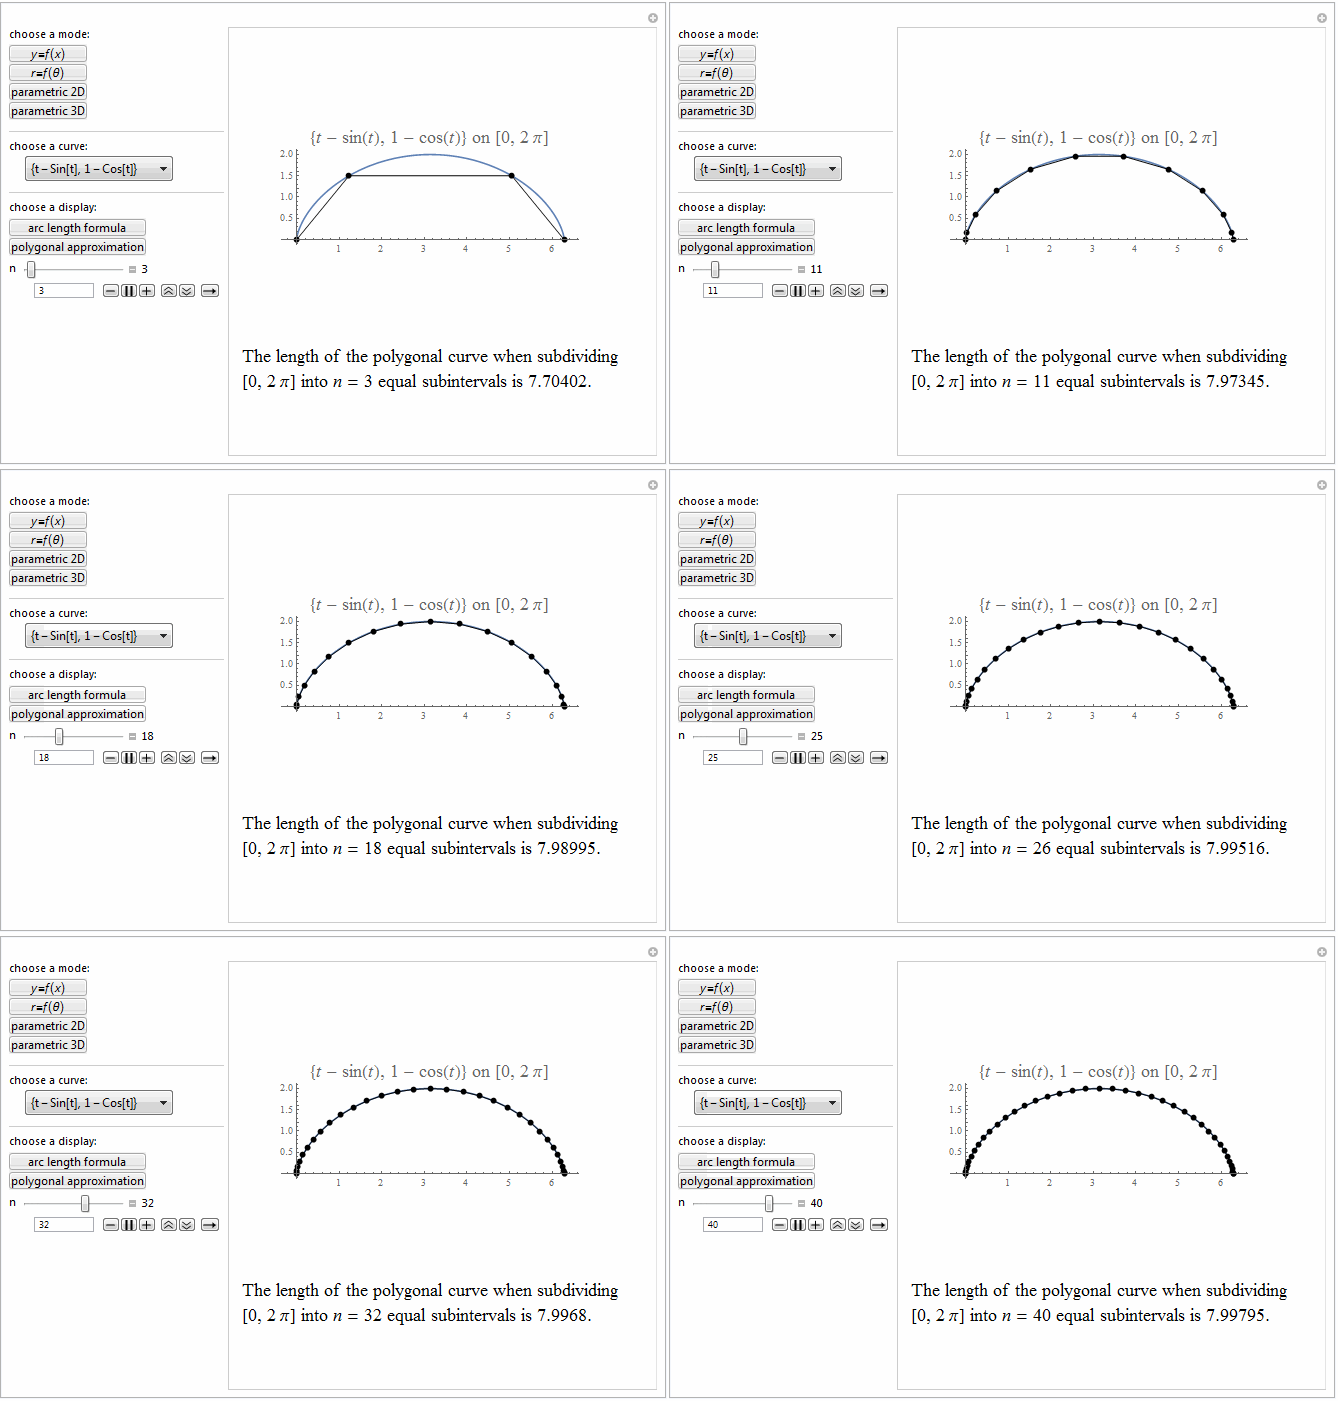
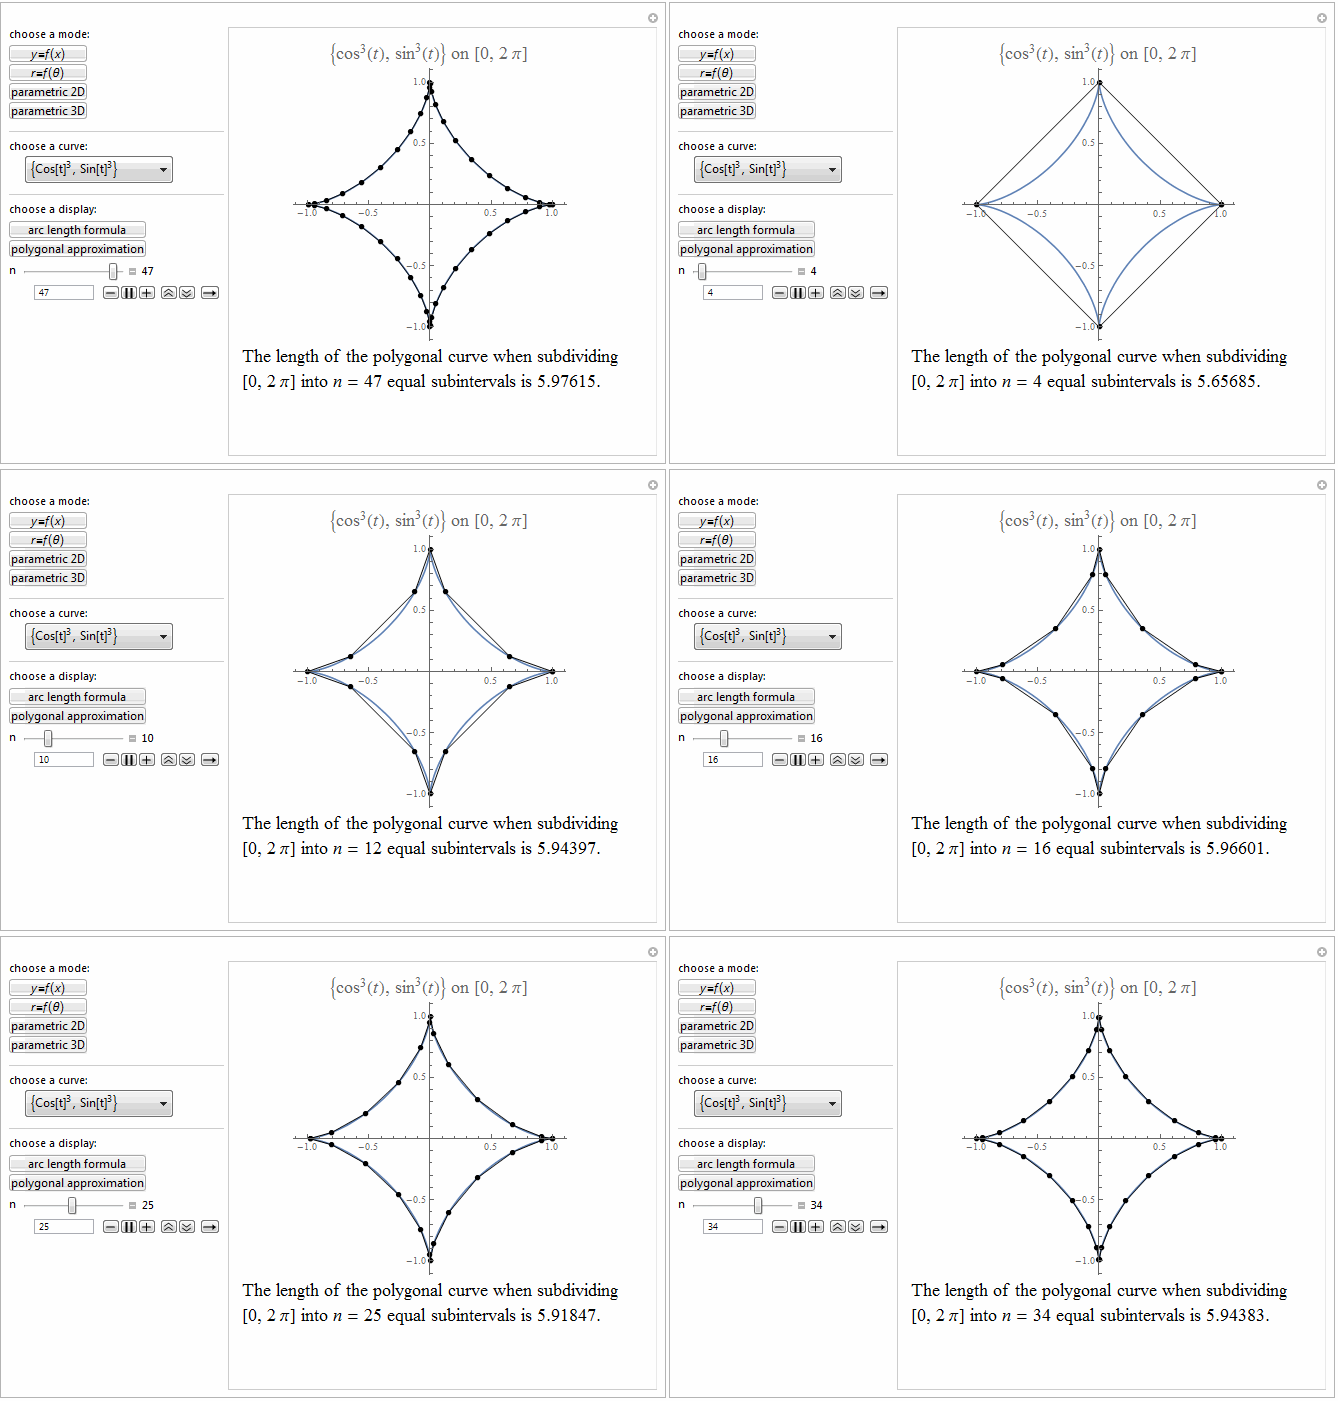
==============================
Manipulate[
Module[{func, curve, arcLength, arcLengthValue, arcLengthComputation,
coords, points, polygonal, para2D, para3D, pol, polyLength},
Switch[mode, 1,
max = 2; func = curves;
curve =
Plot[func, {x, 0, max}, PlotRange -> All, AxesOrigin -> {0, 0}];
arcLength = NIntegrate[Sqrt[D[func, x]^2 + 1], {x, 0, max}];
arcLengthValue =
If[MemberQ[{x^3, Sin[Pi/2 x]}, curves],
NIntegrate[Sqrt[D[func, x]^2 + 1], {x, 0, max}],
Integrate[Sqrt[D[func, x]^2 + 1], {x, 0, max}]];
arcLengthComputation =
Row[{"\!\(\*SubsuperscriptBox[\(\[Integral]\), \(\(\\\ \\\ \
\)\(0\)\), \(2\)]\)", TraditionalForm[Sqrt[D[func, x]^2 + 1]],
it["d\[InvisibleSpace]x"],
If[MemberQ[{x^3, Sin[Pi/2 x]}, curves],
Row[{" \[TildeTilde] ", arcLength}],
Row[{" = ", arcLengthValue, " \[TildeTilde] ", arcLength}]]}];
coords = Table[{x, func}, {x, 0, max, max/n}];
points = Graphics[{PointSize[0.02], Point[coords]}];
polygonal = Graphics[Line[coords]],
2,
max = 2 Pi; para2D = curves;
curve = ParametricPlot[para2D, {t, 0, max}, PlotRange -> All];
arcLength =
NIntegrate[
Sqrt[D[para2D[[1]], t]^2 + D[para2D[[2]], t]^2], {t, 0, max}];
arcLengthValue =
If[MemberQ[{{2 Cos[t], Sin[t]}, {Cos[t], Sin[3 t]}}, curves],
NIntegrate[
Sqrt[D[para2D[[1]], t]^2 + D[para2D[[2]], t]^2], {t, 0, max}],
Integrate[
Sqrt[D[para2D[[1]], t]^2 + D[para2D[[2]], t]^2], {t, 0, max}]];
arcLengthComputation =
Row[{"\!\(\*SubsuperscriptBox[\(\[Integral]\), \(\(\\\ \\\ \
\)\(0\)\), \(2 \[Pi]\)]\)",
TraditionalForm[
Sqrt[D[para2D[[1]], t]^2 + D[para2D[[2]], t]^2]],
it["d\[InvisibleSpace]t"],
If[MemberQ[{{2 Cos[t], Sin[t]}, {Cos[t], Sin[3 t]}}, curves],
Row[{" \[TildeTilde] ", arcLength}],
If[MemberQ[{{Cos[t], Sin[t]}}, curves],
Row[{" = ", arcLengthValue, " \[TildeTilde] ", arcLength}],
Row[{" = ", arcLengthValue}]]]}];
coords = Table[para2D, {t, 0, max, max/n}];
points = Graphics[{PointSize[0.02], Point[coords]}];
polygonal = Graphics[Line[coords]],
3,
max = 4 Pi; para3D = curves;
curve =
ParametricPlot3D[para3D, {t, 0, max}, PlotRange -> All,
AspectRatio -> 1];
arcLength =
NIntegrate[
Sqrt[D[para3D[[1]], t]^2 + D[para3D[[2]], t]^2 +
D[para3D[[3]], t]^2], {t, 0, max}];
arcLengthValue =
If[MemberQ[{{Cos[t], Sin[t], Cos[t/2]}}, curves],
NIntegrate[
Sqrt[D[para3D[[1]], t]^2 + D[para3D[[2]], t]^2 +
D[para3D[[3]], t]^2], {t, 0, max}],
Integrate[
Sqrt[D[para3D[[1]], t]^2 + D[para3D[[2]], t]^2 +
D[para3D[[3]], t]^2], {t, 0, max}]];
arcLengthComputation =
Row[{"\!\(\*SubsuperscriptBox[\(\[Integral]\), \(\(\\\ \\\ \
\)\(0\)\), \(4 \[Pi]\)]\)",
TraditionalForm[
Sqrt[D[para3D[[1]], t]^2 + D[para3D[[2]], t]^2 +
D[para3D[[3]], t]^2]], it["dt"],
If[MemberQ[{{Cos[t], Sin[t], Cos[t/2]}}, curves],
Row[{" \[TildeTilde] ", arcLength}],
Row[{" = ", arcLengthValue, " \[TildeTilde] ", arcLength}]]}];
coords = Table[para3D, {t, 0, max, max/n}];
points = Graphics3D[{PointSize[0.02], Point[coords]}];
polygonal = Graphics3D[Line[coords]],
4,
max = 2 Pi; pol = curves;
curve = PolarPlot[pol, {\[Theta], 0, max}, PlotRange -> All];
arcLength =
NIntegrate[Sqrt[D[pol, \[Theta]]^2 + pol^2], {\[Theta], 0, max}];
arcLengthValue =
If[MemberQ[{}, curves],
NIntegrate[Sqrt[D[pol, \[Theta]]^2 + pol^2], {\[Theta], 0, max}],
Integrate[Sqrt[D[pol, \[Theta]]^2 + pol^2], {\[Theta], 0, max}]];
arcLengthComputation =
Row[{"\!\(\*SubsuperscriptBox[\(\[Integral]\), \(\(\\\ \\\ \
\)\(0\)\), \(2 \[Pi]\)]\)",
TraditionalForm[Sqrt[D[pol, \[Theta]]^2 + pol^2]], it["d"],
"\[Theta]",
If[MemberQ[{3 Sin[2 \[Theta]], 1 + 2 Cos[\[Theta]]}, curves],
Row[{" \[TildeTilde] ", arcLength}],
If[MemberQ[{\[Theta], \[Theta]^2}, curves],
Row[{" = ", arcLengthValue, " \[TildeTilde] ", arcLength}],
Row[{" = ", arcLengthValue}]]]}];
coords =
Table[{pol Cos[\[Theta]], pol Sin[\[Theta]]}, {\[Theta], 0, max,
max/n}];
points = Graphics[{PointSize[0.02], Point[coords]}];
polygonal = Graphics[Line[coords]]
];
polyLength =
Sum[Norm[N[coords[[i + 1]]] - N[coords[[i]]]], {i, 1, n}];
Text@Pane[
Column[{If[arc,
Show[curve, points,
PlotLabel -> Style[Row[{curves, " on [0, ", max, "]"}], 18],
ImageSize -> {300, 300}],
Show[curve, points, polygonal,
PlotLabel -> Style[Row[{curves, " on [0, ", max, "]"}], 18],
ImageSize -> {300, 300}]],
If[arc,
Style[Row[{"The length of the curve above is ",
TraditionalForm@arcLengthComputation, "."}], 18],
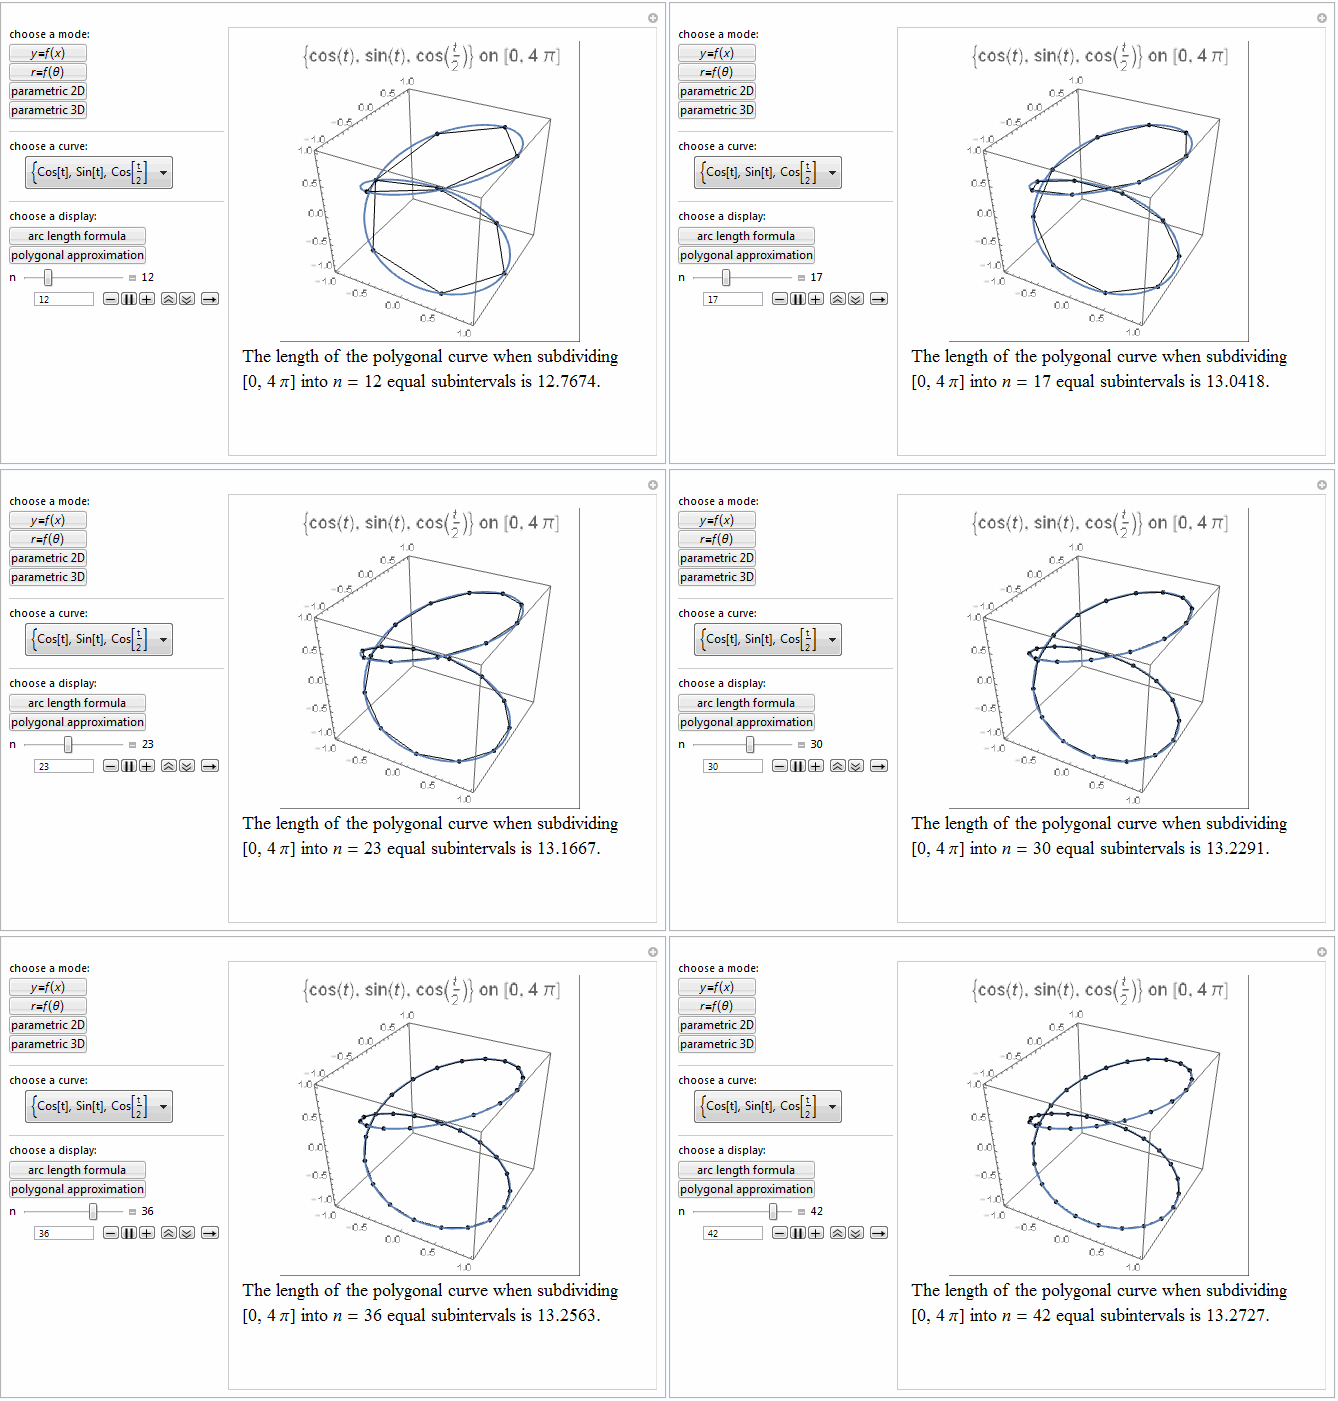
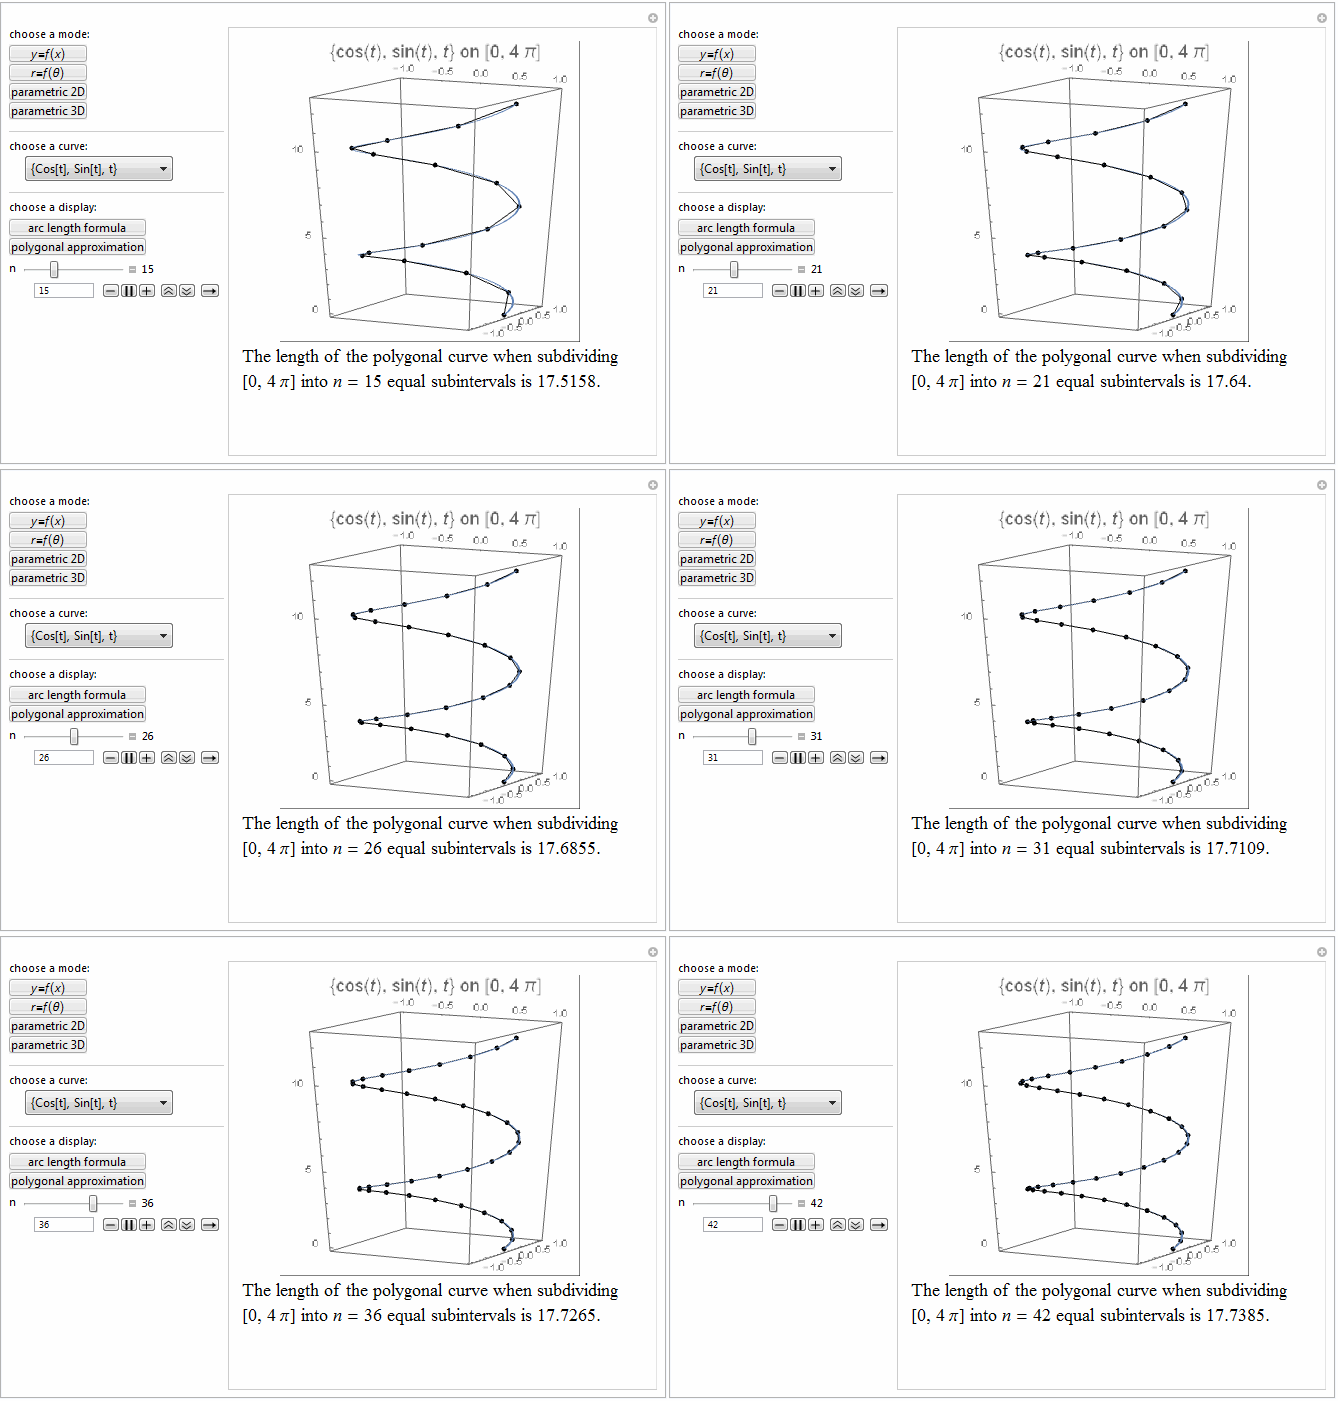
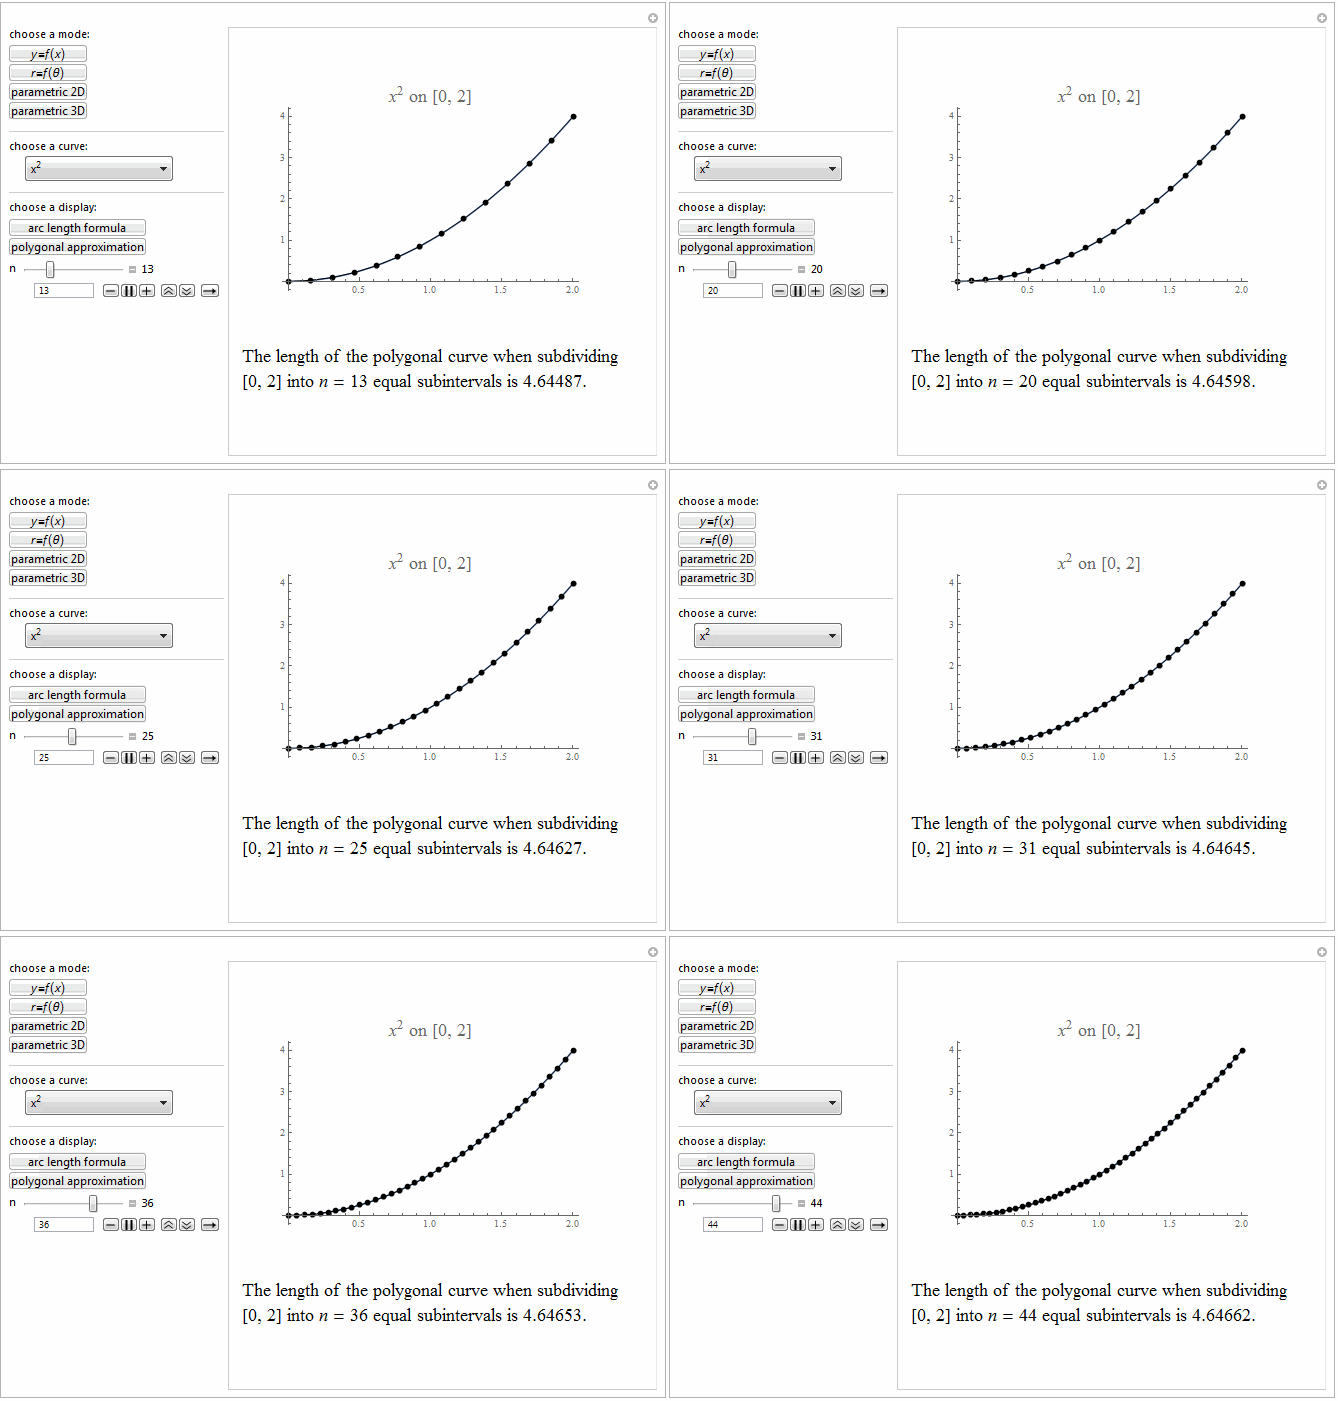
Style[Row[{"The length of the polygonal curve when subdividing\
\n[0, ", max, "] into ", it["n"], " = ", n ,
" equal subintervals is ", polyLength, "."}], 18]]},
Alignment -> Center], ImageSize -> {400, 400}]],
Row[{"choose a mode:"}],
ButtonBar[{Row[{it["y"], "=", it["f"], "(", it["x"], ")"}] :> {mode =
1; curves = curveLists[[mode, 1]]},
Row[{it["r"], "=", it["f"], "(\[Theta])"}] :> {mode = 4;
curves = curveLists[[mode, 1]]}, "parametric 2D" :> {mode = 2;
curves = curveLists[[mode, 1]]},
"parametric 3D" :> {mode = 3; curves = curveLists[[mode, 1]]}},
Appearance -> "Vertical"],
Delimiter,
Row[{"choose a curve:"}],
{{mode, 1}, ControlType -> None},
{{max, 2}, ControlType -> None},
{{curveList, curveLists[[1]]}, ControlType -> None},
{{curves, curveLists[[1, 1]], Null}, curveLists[[mode]],
ControlType -> PopupMenu, ImageSize -> 150},
Delimiter,
Row[{"choose a display:"}],
ButtonBar[{"arc length formula" :> {arc = True; n = 1},
"polygonal approximation" :> {arc = False}},
Appearance -> "Vertical"],
{{arc, True}, {False, True}, ControlType -> None},
{{n, 1}, 1, 50, 1, Enabled -> (arc == False),
Appearance -> "Labeled", ImageSize -> Small},
ControlPlacement -> Left,
TrackedSymbols -> True,
Initialization :> (it = Style[#, Italic] &;
curveLists = {{x^2, x^3, x^(3/2), Sqrt[x], Cosh[x],
Sin[Pi/2 x]}, {{Cos[t], Sin[t]}, {2 Cos[t], Sin[t]}, {Cos[t],
Sin[3 t]}, {t - Sin[t], 1 - Cos[t]}, {Cos[t]^3,
Sin[t]^3}}, {{Cos[t], Sin[t], t}, {Cos[t], Sin[t],
Cos[t/2]}}, {\[Theta], \[Theta]^2, 1 + Sin[\[Theta]],
3 Sin[2 \[Theta]], 1 + 2 Cos[\[Theta]]}}),
AutorunSequencing -> {5, 6}]
|
