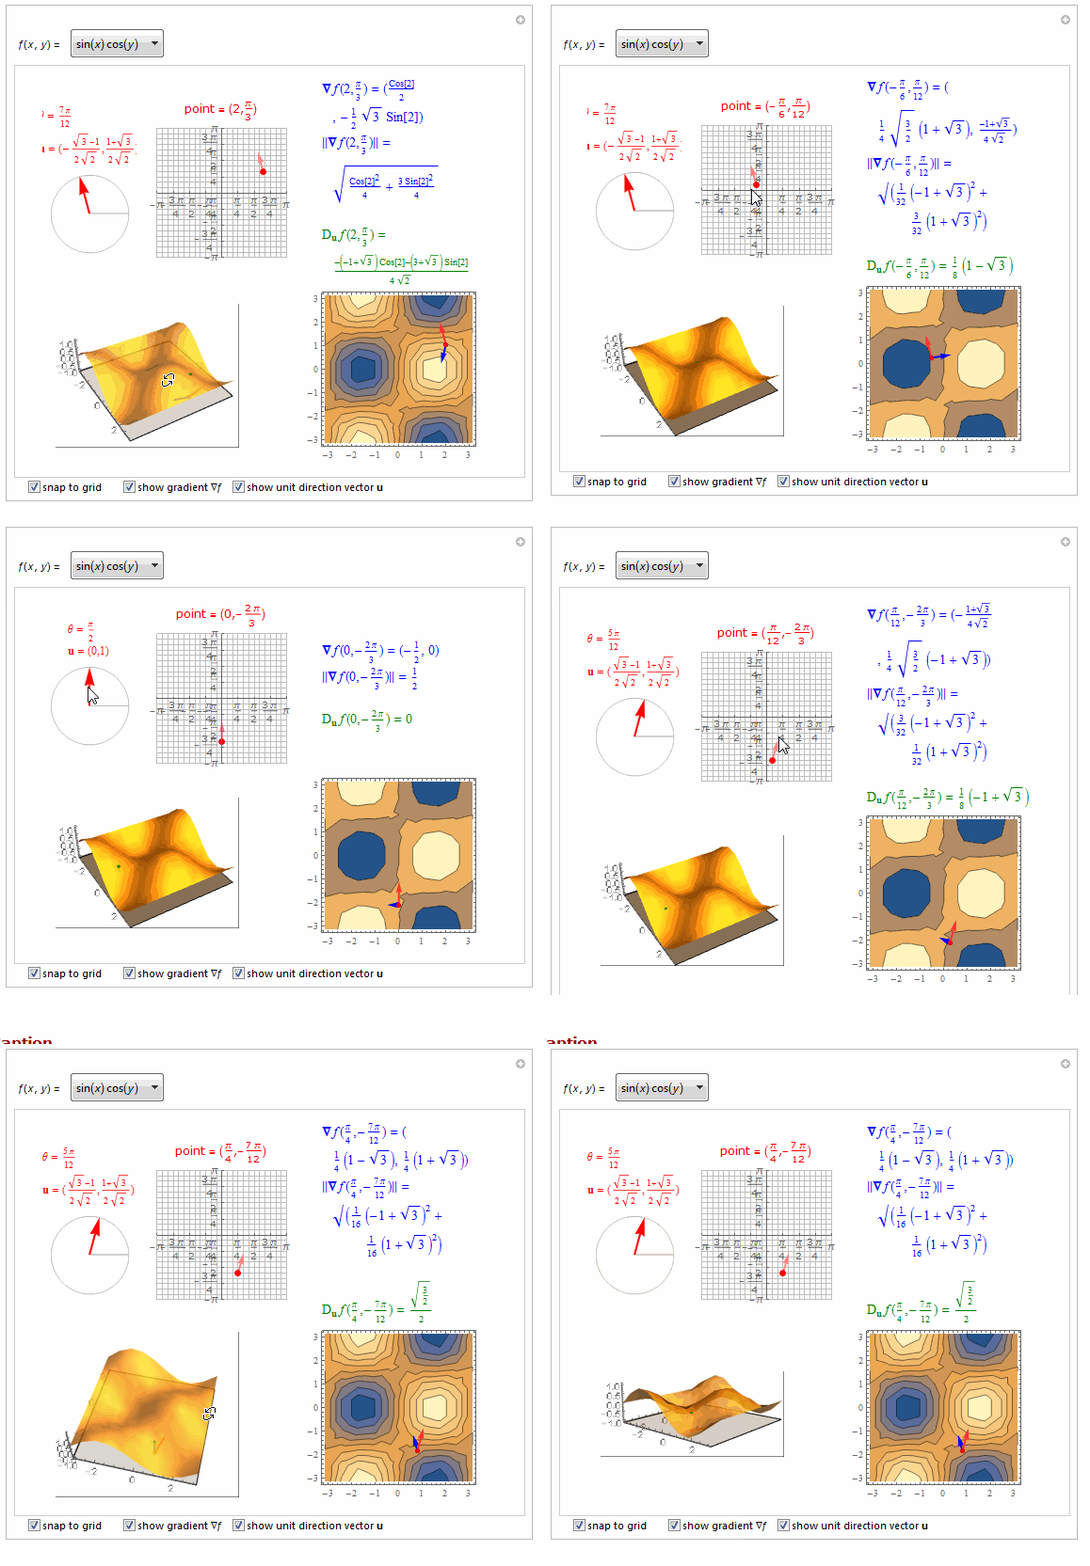
===============================================================
Manipulate[
rnd[x_] := If[Accuracy[x] == Infinity, x, Round[x, 0.01]];
pitest[x_] := Or[Head[x/Pi] === Integer, Head[x/Pi] === Rational];
DynamicModule[{surfacegraph, anglegraph, contourgraph, pointgraph,
ff , xmin, xmax, ymin, ymax, zmin, zmax, xgrid1, ygrid1,
thept = ptctrl, angpt = {Cos[angctrl], Sin[angctrl]},
ang = angctrl},
Switch[fcn,
f1,
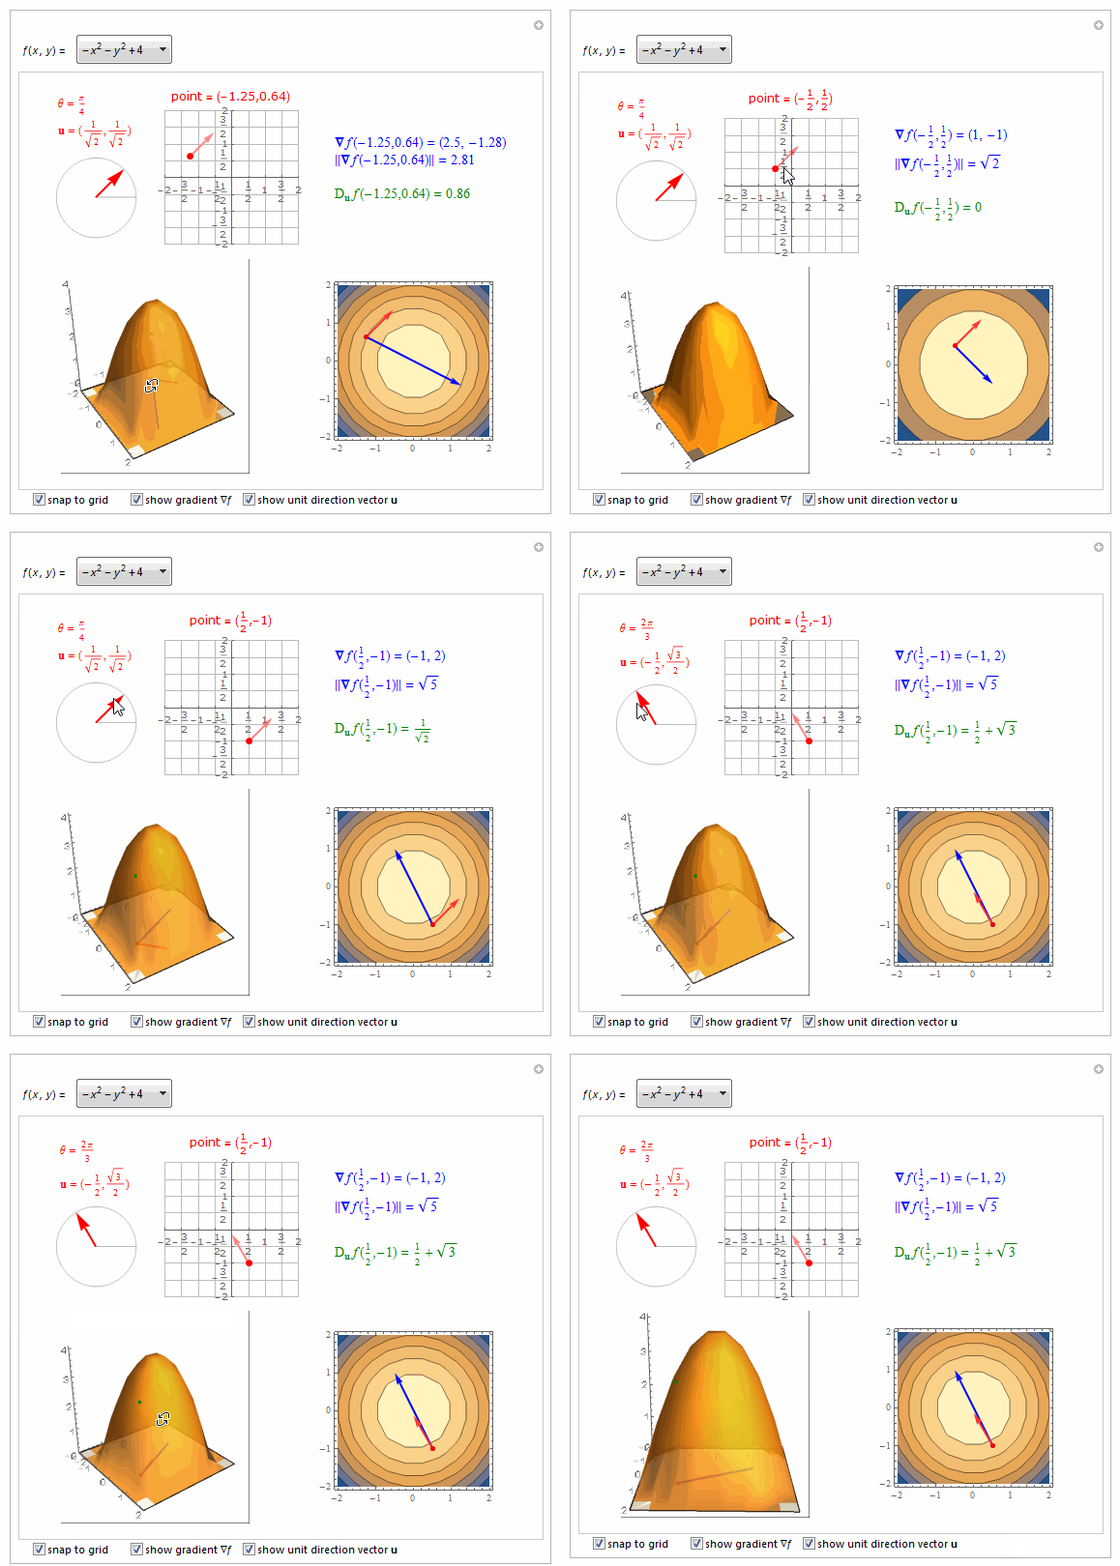
ff[x_, y_] := 4 - x^2 - y^2;
xmin = -2; xmax = 2; ymin = -2; ymax = 2; zmin = 0; zmax = 4.1;
{xgrid1, ygrid1} = {1/2, 1/2},
f2,
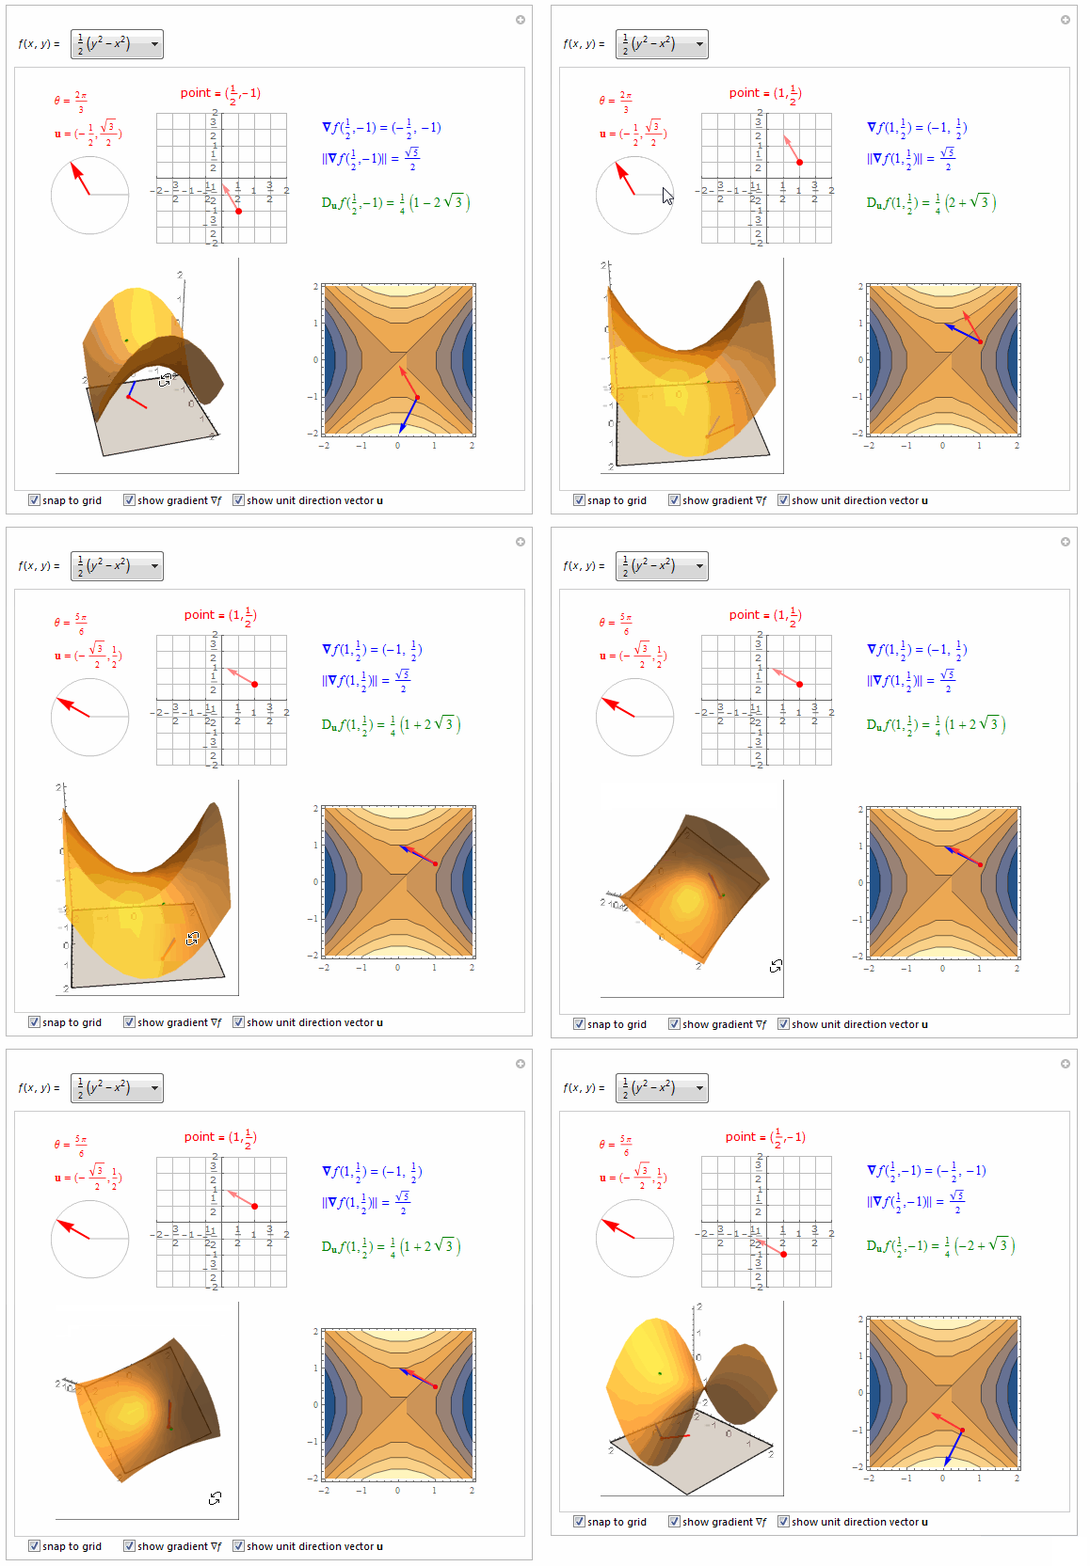
ff[x_, y_] := (y^2 - x^2)/2;
xmin = -2; xmax = 2; ymin = -2; ymax = 2; zmin = -2.1; zmax = 2.1;
{xgrid1, ygrid1} = {1/2, 1/2},
f3,
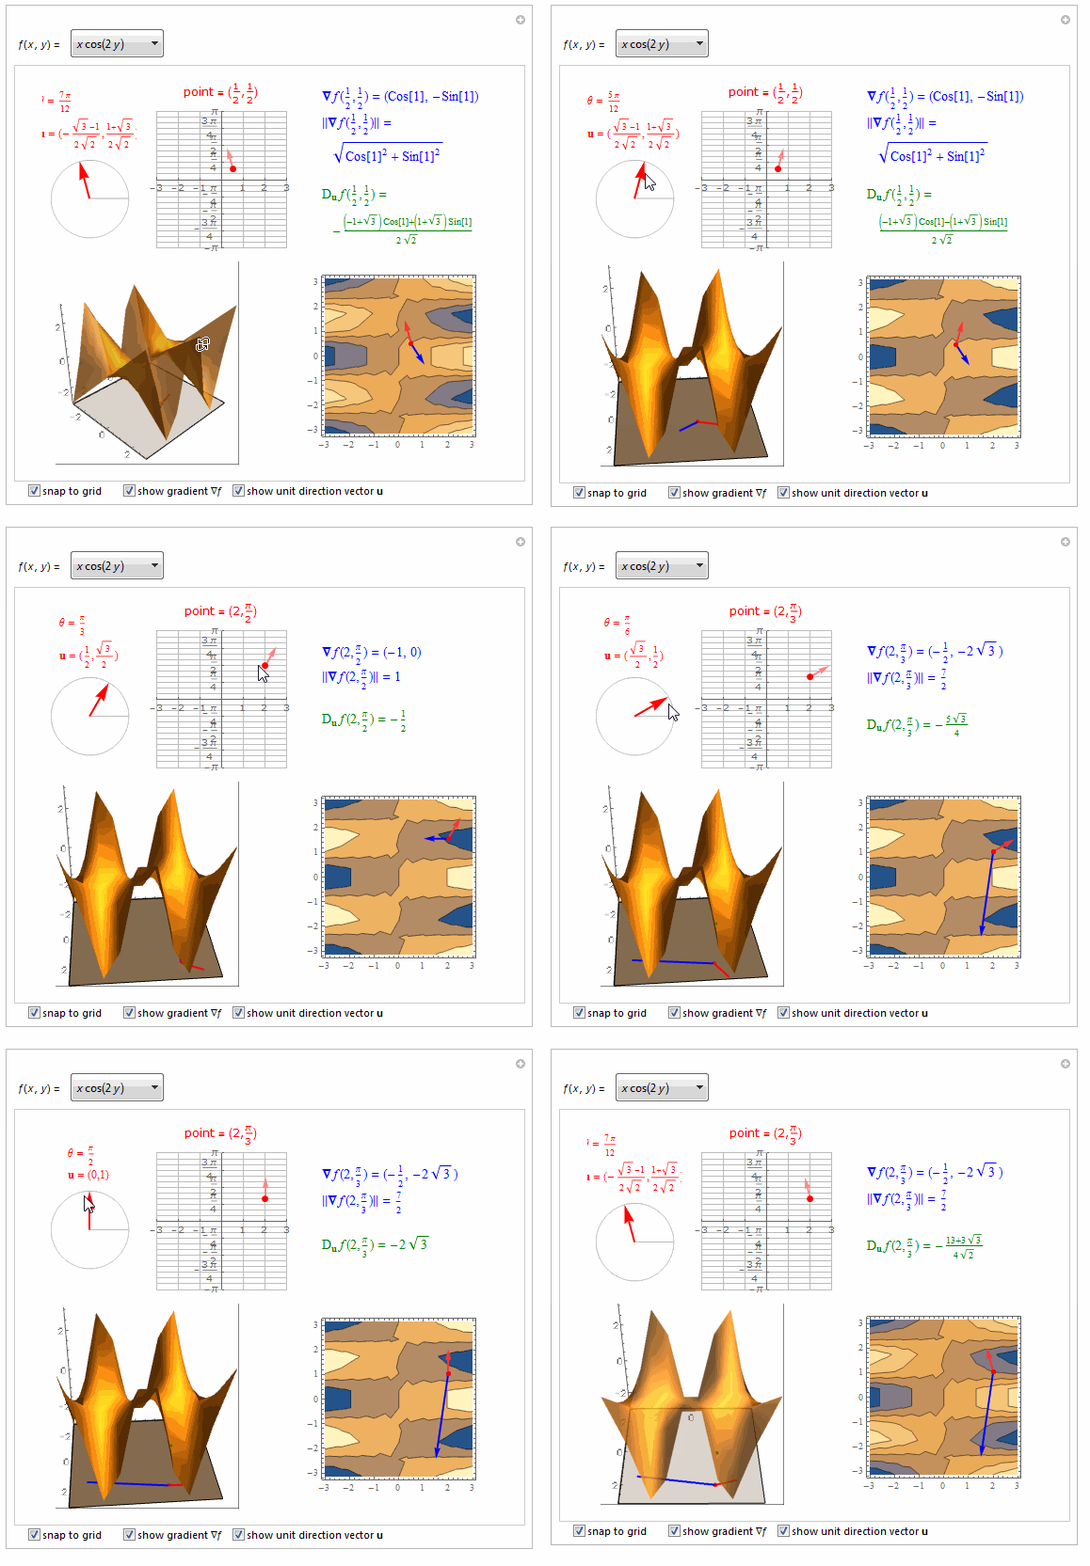
ff[x_, y_] := x Cos[2 y];
xmin = -3; xmax = 3; ymin = -Pi; ymax = Pi; zmin = -3.1; zmax = 3.1;
{xgrid1, ygrid1} = {1, Pi/12},
f4,
ff[x_, y_] := Sin[x] Cos[y];
xmin = -Pi; xmax = Pi; ymin = -Pi; ymax = Pi; zmin = -1.1;
zmax = 1.1;
{xgrid1, ygrid1} = {Pi/12, Pi/12},
f5,
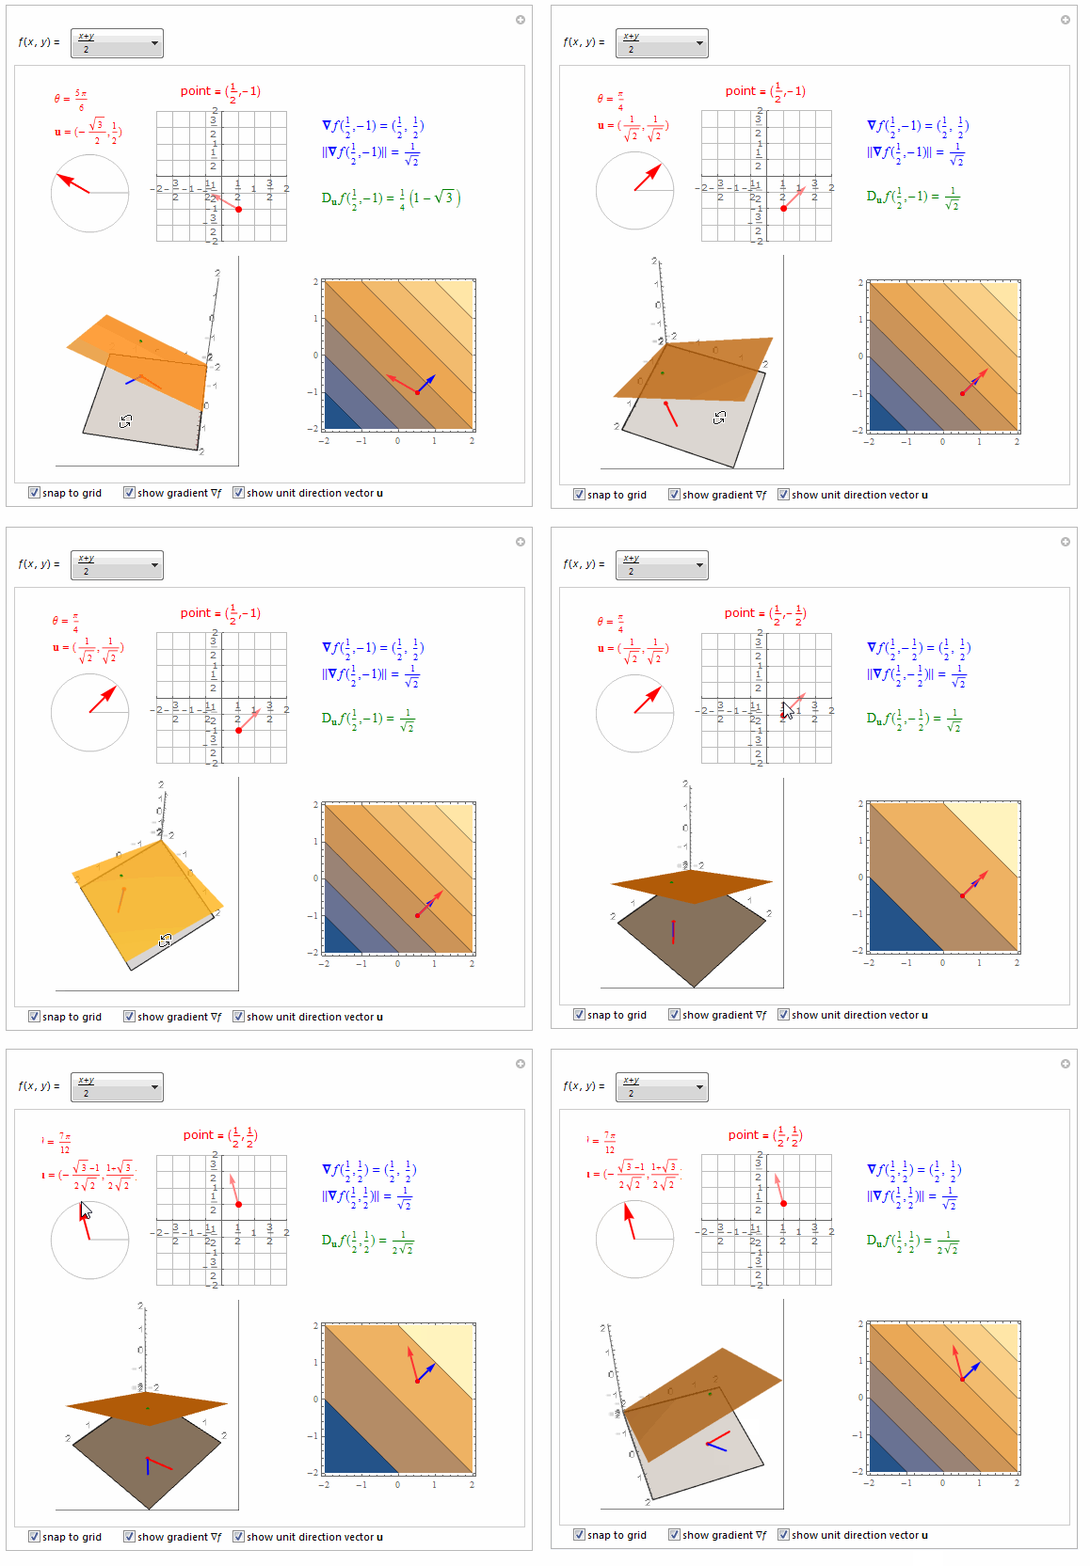
ff[x_, y_] := (x + y)/2;
xmin = -2; xmax = 2; ymin = -2; ymax = 2; zmin = -2.1; zmax = 2.1;
{xgrid1, ygrid1} = {1/2, 1/2}
];
{xgrid, ygrid} =
If[MemberQ[opts, gridsnap], {xgrid1, ygrid1}, {0.001, 0.001}];
surfacegraph[thept_, angpt_] :=
Show[
Plot3D[ff[x, y], {x, xmin, xmax}, {y, ymin, ymax},
PlotStyle -> Opacity[ControlActive[1, 0.8]], Mesh -> False,
PlotRange -> {{xmin, xmax}, {ymin, ymax}, {zmin, zmax}},
PerformanceGoal -> "Speed"],
Graphics3D[{{Darker[Green, 0.5], PointSize[0.02],
Point[{thept[[1]], thept[[2]], ff[thept[[1]], thept[[2]]]}]},
If[MemberQ[opts,
showgrad], {{Blue, Thick,
Line[{{thept[[1]], thept[[2]], zmin},
Append[thept + D[ff[x, y], {{x, y}}] /. {x -> thept[[1]],
y -> thept[[2]]}, zmin]}]},
{Blue, PointSize[0.025],
Point[{thept[[1]], thept[[2]], zmin}]}}, {}],
If[MemberQ[opts, showunit],
{{Red, PointSize[0.025],
Point[{thept[[1]], thept[[2]], zmin}]}, {Red, Thick,
Line[{{thept[[1]], thept[[2]],
zmin}, {thept[[1]] + angpt[[1]], thept[[2]] + angpt[[2]],
zmin}}]}}, {}],
{Gray, Opacity[ControlActive[1, 0.3]],
Polygon[{{xmin, ymin, zmin}, {xmin, ymax, zmin}, {xmax, ymax,
zmin}, {xmax, ymin, zmin}}]}
}],
ParametricPlot3D[{angpt[[1]] t + thept[[1]],
angpt[[2]] t +
thept[[2]], (D[ff[x, y], {{x, y}}].angpt /. {x -> thept[[1]],
y -> thept[[2]]}) t + f[thept[[1]], thept[[2]]]}, {t, -1,
1}, PlotStyle -> Darker[Green, 0.5], MaxRecursion -> 0,
PerformanceGoal -> "Speed"],
AxesEdge -> {{-1, -1}, {-1, -1}, {-1, -1}}, ImageSize -> 195,
BoxRatios -> {xmax - xmin, ymax - ymin, zmax - zmin},
PlotRange -> {{xmin, xmax}, {ymin, ymax}, {zmin, zmax}},
Boxed -> False
];
anglegraph[angpt_, opts___] :=
Graphics[{{Lighter[Gray, 0.5],
Circle[{0, 0}, 1]}, {Lighter[Gray, 0.5], Line[{{0, 0}, {1, 0}}]},
{Red, Thick, Arrowheads[Large], Arrow[{{0, 0}, angpt}]}},
PlotRange -> 1.2, ImageSize -> 100, opts];
contourgraph[thept_, angpt_] :=
Show[ContourPlot[ff[x, y], {x, xmin, xmax}, {y, ymin, ymax},
Contours -> ControlActive[3, Automatic],
FrameTicks -> {Table[
n, {n, xmin, xmax, If[pitest[xgrid1], 3 xgrid1, xgrid1]}],
Table[n, {n, ymin, ymax,
If[pitest[ygrid1], 3 ygrid1, ygrid1]}], True, True},
PerformanceGoal -> "Speed"],
Graphics[{
If[MemberQ[opts,
showgrad], {{Blue, PointSize[0.03], Point[thept]}, {Blue,
Thick, Arrowheads[Medium],
Arrow[{thept,
thept + D[ff[x, y], {{x, y}}] /. {x -> thept[[1]],
y -> thept[[2]]}}]}}, {}],
If[MemberQ[opts,
showunit], {{Lighter[Red, 0.2], Thick, Arrowheads[Medium],
Arrow[{thept, thept + angpt}]}, {Red, PointSize[0.03],
Point[thept]}}, {}]}], ImageSize -> 180,
AspectRatio -> Automatic];
pointgraph[thept_, angpt_, opts___] :=
Graphics[{{Lighter[Red, 0.5], Thick, Arrowheads[Medium],
Arrow[{thept, thept + angpt}]}, {Red, PointSize[0.05],
Point[thept]}}, Axes -> True,
PlotRange -> {{xmin, xmax}, {ymin, ymax}},
AspectRatio -> Automatic, opts,
GridLines -> {Table[{n, Lighter[Gray, 0.5]}, {n, xmin, xmax,
xgrid1}],
Table[{n, Lighter[Gray, 0.5]}, {n, ymin, ymax, ygrid1}]},
Ticks -> {Table[
n, {n, xmin, xmax, If[pitest[xgrid1], 3 xgrid1, xgrid1]}],
Table[n, {n, ymin, ymax,
If[pitest[ygrid1], 3 ygrid1, ygrid1]}]},
BaseStyle -> {10, "Label"}, ImageSize -> 150];
Column[{
Grid[{
{Grid[{{Deploy@LocatorPane[Dynamic[angpt,
{(angpt = {Cos[angctrl], Sin[angctrl]}) &,
(ang =
If[MemberQ[opts, gridsnap],
Round[Mod[ArcTan[#[[1]], #[[2]]], 2 Pi], Pi/12],
Mod[ArcTan[#[[1]], #[[2]]], 2 Pi]];
angpt = Normalize[{Cos[ang], Sin[ang]}]) &,
(angpt = Normalize[{Cos[ang], Sin[ang]}];
angctrl =
Mod[ArcTan[angpt[[1]], angpt[[2]]], 2 Pi]) &}],
Dynamic[
anglegraph[angpt,
PlotLabel ->
Column[{Style[Row[{"\[Theta] = ", Simplify[rnd@ang]}],
Red], Style[
Row[{Style["u", Bold], " = (",
Simplify[rnd@angpt[[1]]], ",",
Simplify[rnd@angpt[[2]]], ")"}], Red]}]]],
Appearance -> None],
Deploy@LocatorPane[Dynamic[thept,
{thept = ptctrl,
(thept =
If[MemberQ[opts, gridsnap],
Round[#, {xgrid, ygrid}], #]) &,
(thept =
If[MemberQ[opts, gridsnap],
Round[#, {xgrid, ygrid}], #];
ptctrl =
If[MemberQ[opts, gridsnap],
Round[#, {xgrid, ygrid}], #]) &}],
Dynamic[
pointgraph[thept, angpt,
PlotLabel ->
Style[Row[{"point = (", rnd@thept[[1]], ",",
rnd@thept[[2]], ")"}], Red]]], Appearance -> None],
" ",
Column[{
Deploy@Dynamic[Text[Column[Style[#, 14] & /@ {
Style[Row[{Style["\[Del]", Bold], TraditionalForm@f,
"(", rnd@thept[[1]], ",", rnd@thept[[2]], ") = ",
"(", (rnd[
D[ff[x, y], {{x, y}}] /. {x -> thept[[1]],
y -> thept[[2]]}])[[1]],
", ", (rnd[
D[ff[x, y], {{x, y}}] /. {x -> thept[[1]],
y -> thept[[2]]}])[[2]], ")"}], Blue],
Style[Row[{"||", Style["\[Del]", Bold],
TraditionalForm@f, "(", rnd@thept[[1]], ",",
rnd@thept[[2]], ")|| = ",
rnd[Norm[
D[ff[x, y], {{x, y}}] /. {x -> thept[[1]],
y -> thept[[2]]}]]}], Blue],
"",
Style[Row[{Subscript["D", Style["u", Bold]],
TraditionalForm@f, "(", thept[[1]], ",",
thept[[2]], ") = ",
Simplify@
rnd[D[ff[x, y], {{x, y}}].angpt /. {x ->
thept[[1]], y -> thept[[2]]}]}],
Darker[Green, 0.5]]
}]]]
}, ItemSize -> {"Columns" -> {15, 20, 5, 10}},
Alignment -> Left]}}],
SpanFromLeft},
{Dynamic[surfacegraph[thept, angpt]],
Deploy@Dynamic[contourgraph[thept, angpt]]}
}, ItemSize -> {20}]
}, Alignment -> {Center, Top}, ItemSize -> {"Rows" -> {20, 6}}]
] (*End Module*),
{{fcn, f1,
Row[{TraditionalForm[f[x, y]], " = "}]}, {f1 ->
TraditionalForm[4 - x^2 - y^2],
f2 -> TraditionalForm[(y^2 - x^2)/2],
f5 -> TraditionalForm[(x + y)/2],
f3 -> TraditionalForm[x Cos[2 y]],
f4 -> TraditionalForm[Sin[x] Cos[y]]}, ControlType -> PopupMenu},
{{opts, {showgrad, showunit}, ""}, {gridsnap -> "snap to grid ",
showgrad -> Row[{"show gradient \[Del]", TraditionalForm@f, " "}],
showunit -> Row[{"show unit direction vector ", Style[u, Bold]}]},
ControlType -> CheckboxBar, ControlPlacement -> Bottom},
{{ptctrl, {(xmin + xmax)/2, (ymin + ymax)/2}}, {xmin, ymin}, {xmax,
ymax}, ControlType -> None},
{{angctrl, Pi/4}, 0, 2 Pi, ControlType -> None},
TrackedSymbols :> {fcn, ptctrl, angctrl, opts},
Initialization :> {
xmin = -2; xmax = 2; ymin = -2; ymax = 2; zmin = 0; zmax = 4.1;
{xgrid1, ygrid1} = {1/2, 1/2}
}
]
|
