

=============================================================
Manipulate[
Show[{
curverev1, curve2low,
Graphics3D[
{
Line[{{1, 0, -.04}, {1, 0, .04}}],
Line[{{4, 0, -.04}, {4, 0, .04}}],
{Text[
Row[{Style["y", Italic], " = ", Style["f", Italic], "(",
Style["x", Italic], ")"}], {4.75, 0, 1.2}],
Text[
Style[Row[{Style["y", Italic], " = ", Style["g", Italic], "(",
Style["x", Italic], ")"}], 14], {4.75, 0, .55}],
If[\[Theta]1 < \[Pi]/2 || (Not[solidrev1] && \[Theta]1 > \[Pi]),
Text[Style["a", Italic], {.95, 0, -.25}], {}],
If[\[Theta]1 < \[Pi]/2 || (Not[solidrev1] && \[Theta]1 > \[Pi]),
Text[Style["b", Italic], {4, 0, -.25}], {}],
Text[Style["x", Italic], {5.2, 0, 0}],
Text[Style["y", Italic], {0, 0, 1.5}]},
{RGBColor[0, 0, 0], Line[{{0, 0, 0}, {5, 0, 0}}],
Line[{{0, 0, -4}, {0, 0, 4}}]},
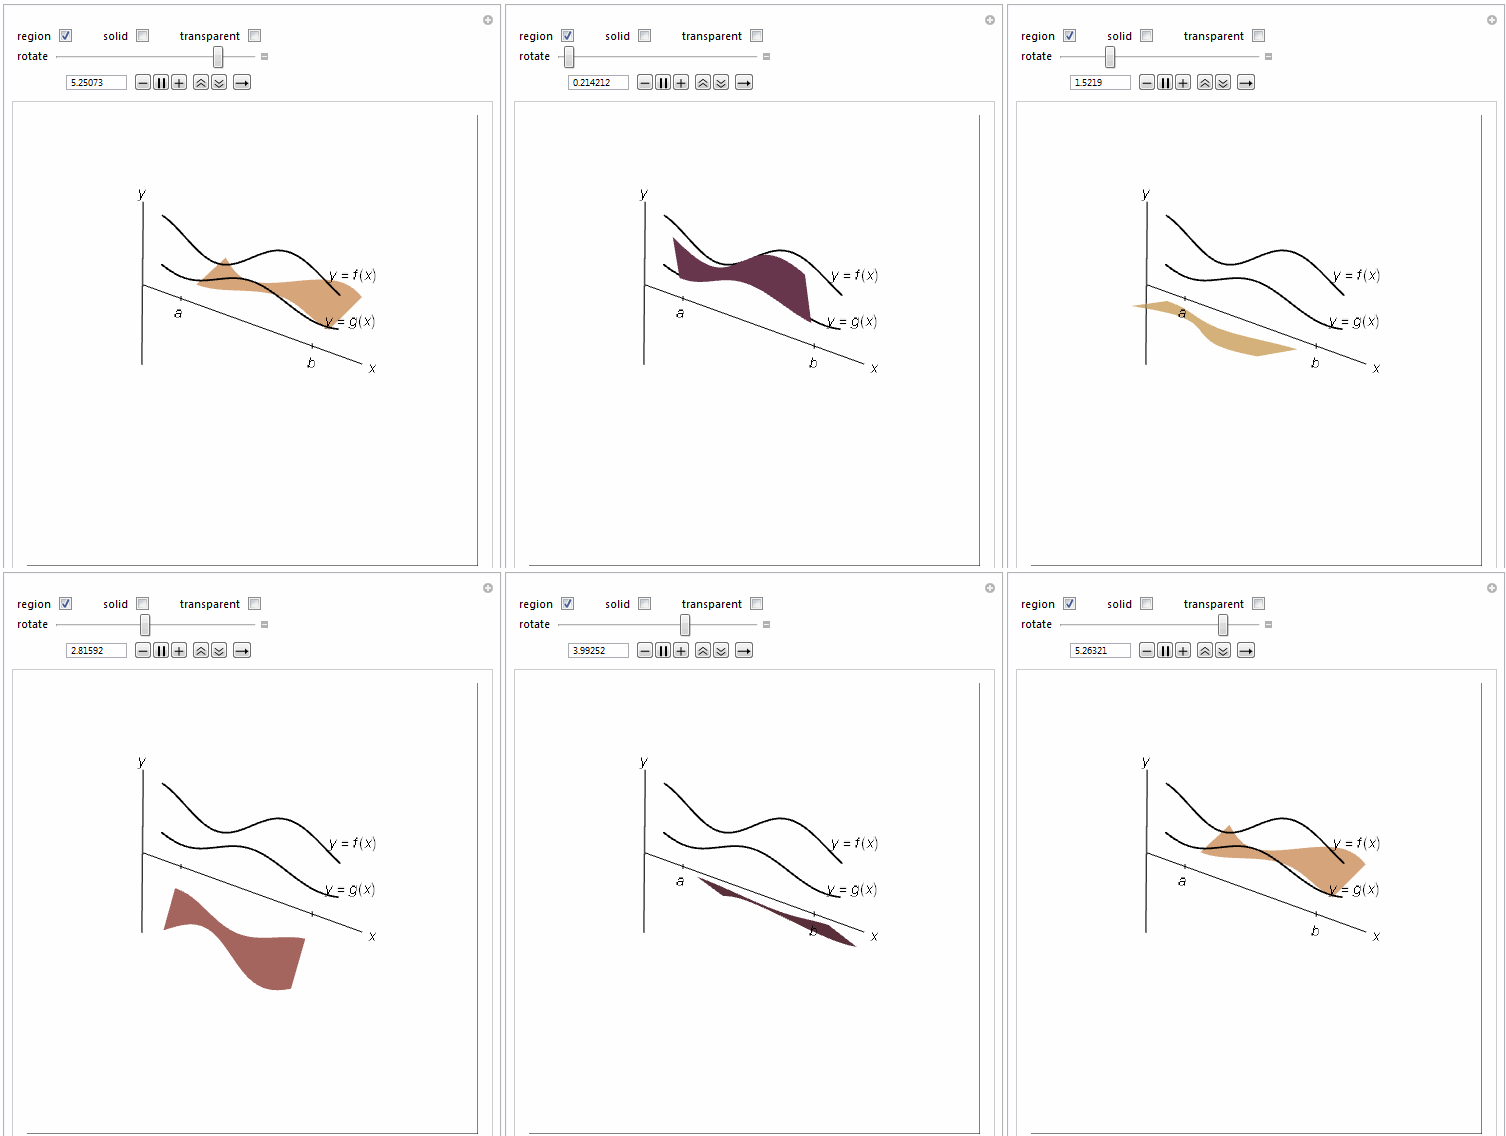
If[(regionrev1 && Not[solidrev1]) || (regionrev1 &&
solidrev1 && \[Theta]1 < 2 \[Pi]), {EdgeForm[None],
LightBlue,
Polygon[Join[
Table[{x, (.25 Sin[2 x + 1] +
1) Sin[-\[Theta]1], (.25 Sin[2 x + 1] +
1) Cos[-\[Theta]1]}, {x, 1, 4, .015}],
Table[{x, (.15 Cos[2 x + 1] + .5) Sin[-\[Theta]1], (.15 Cos[
2 x + 1] + .5) Cos[-\[Theta]1]}, {x, 4,
1, -.015}]]]}, {}],
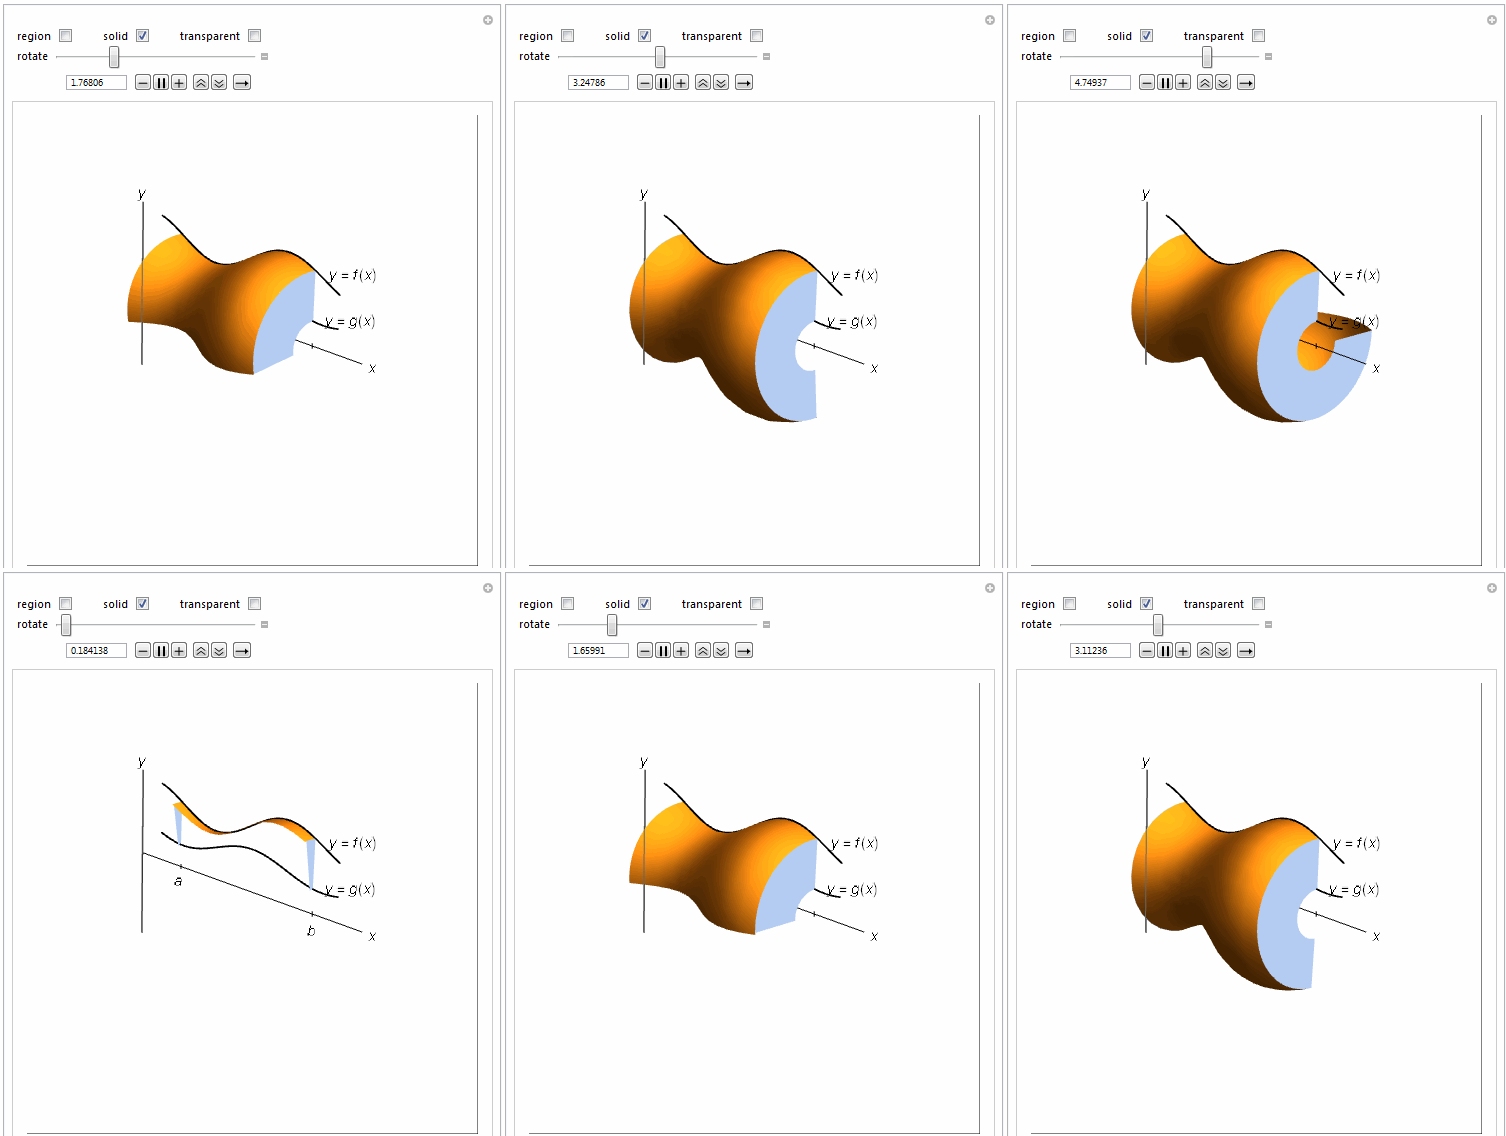
If[solidrev1, {EdgeForm[None],
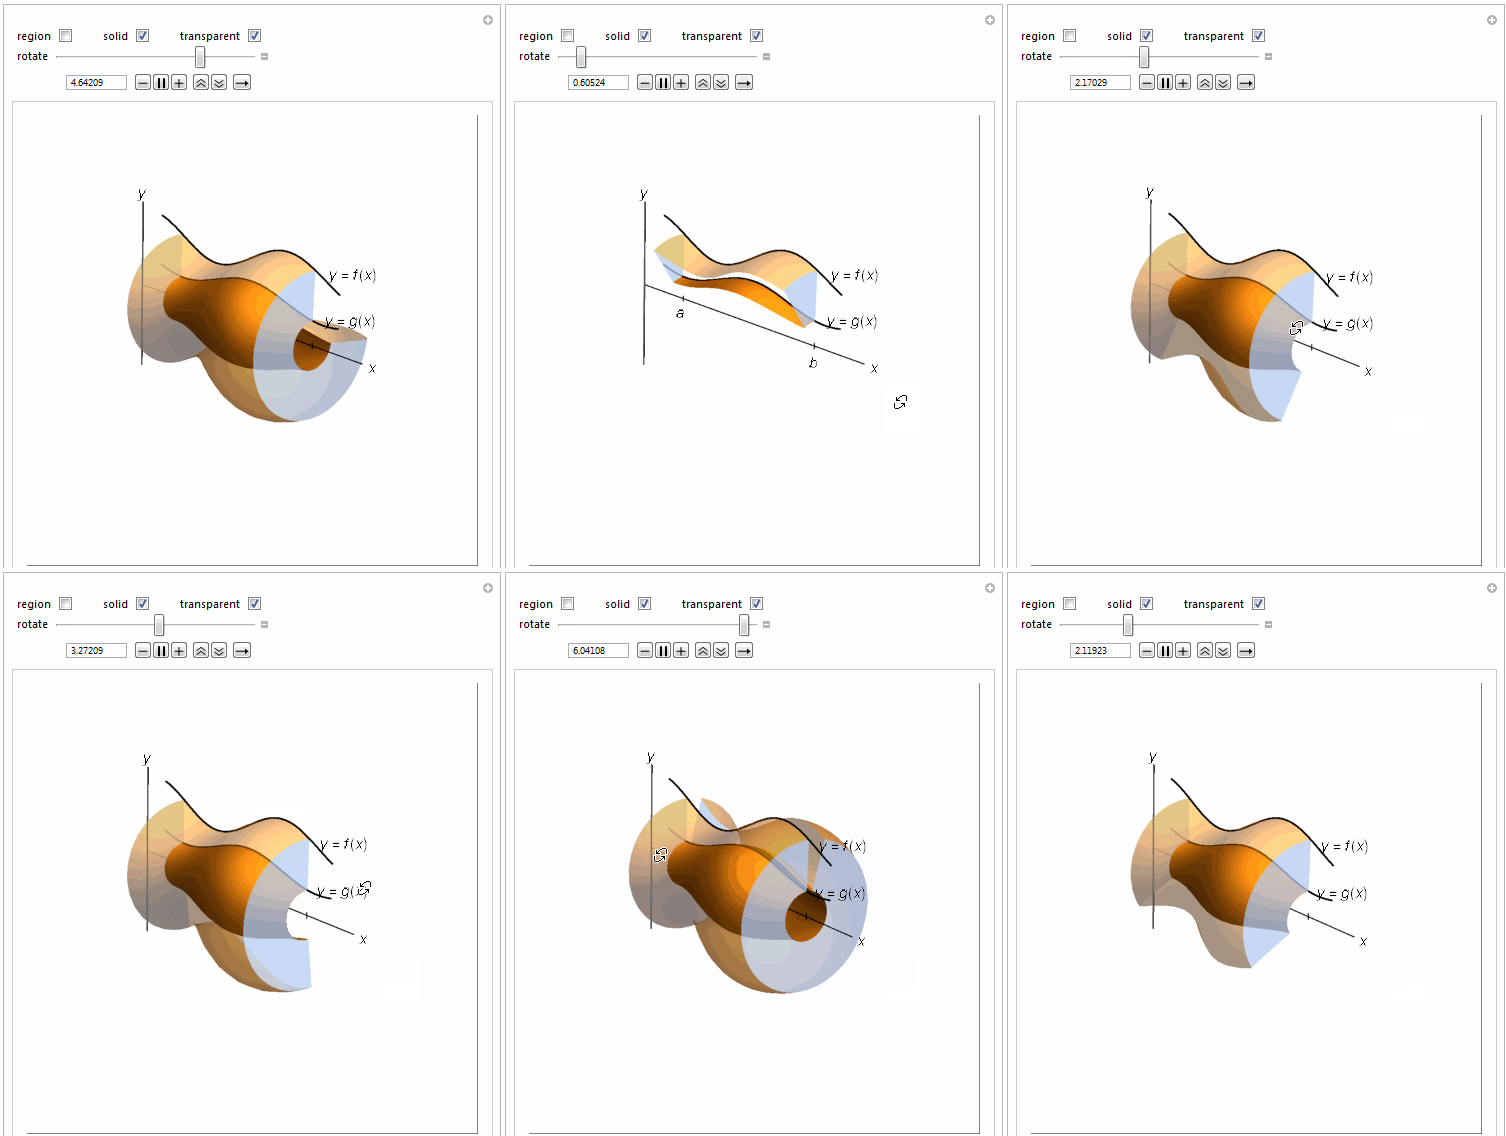
If[washtran, Opacity[.75], Opacity[1]],
Polygon[Join[
Table[{4, (.25 Sin[9] + 1) Sin[-\[Theta]], (.25 Sin[9] +
1) Cos[-\[Theta]]}, {\[Theta],
0, \[Theta]1, \[Pi]/100}],
Table[{4, (.15 Cos[9] + .5) Sin[-\[Theta]], (.15 Cos[
9] + .5) Cos[-\[Theta]]}, {\[Theta], \[Theta]1,
0, -\[Pi]/100}]]]}, {}],
If[solidrev1, {EdgeForm[None],
If[washtran, Opacity[.75], Opacity[1]],
Polygon[Join[
Table[{1, (.25 Sin[3] + 1) Sin[-\[Theta]], (.25 Sin[3] +
1) Cos[-\[Theta]]}, {\[Theta],
0, \[Theta]1, \[Pi]/100}],
Table[{1, (.15 Cos[3] + .5) Sin[-\[Theta]], (.15 Cos[
3] + .5) Cos[-\[Theta]]}, {\[Theta], \[Theta]1,
0, -\[Pi]/100}]]]}, {}]
}],
If[solidrev1,
RevolutionPlot3D[.25 Sin[2 t + 1] + 1, {t, 1, 4}, {\[Theta],
0, \[Theta]1}, RevolutionAxis -> {1, 0, 0},
PerformanceGoal -> "Quality", Mesh -> None,
PlotStyle -> If[washtran, Opacity[.5], Opacity[1]]], {}],
If[solidrev1 && washtran,
RevolutionPlot3D[.15 Cos[2 t + 1] + .5, {t, 1, 4}, {\[Theta],
0, \[Theta]1}, RevolutionAxis -> {1, 0, 0},
PerformanceGoal -> "Quality", Mesh -> None,
PlotStyle -> Opacity[1]], {}]
}, PlotRange -> {{0, 5}, {-2, 2}, {-1.3, 1.3}},
AxesOrigin -> {0, 0, 0}, Boxed -> False,
Axes -> {None, None, Automatic}, ViewPoint -> {1.5, -4, 0},
Background -> White, ImageSize -> {450, 450},
Ticks -> {{1, 4}, None, None}, BaseStyle -> 14]
,
Delimiter,
Grid[{{
Control[{{regionrev1, True, "region"}, Checkbox}],
Spacer[15],
Control[{{solidrev1, True, "solid"}, Checkbox}],
Spacer[15],
Control[{{washtran, False, "transparent"}, Checkbox}],
}}],
{{\[Theta]1, \[Pi], "rotate"}, .0001, 2 \[Pi],
Enabled -> Dynamic[(regionrev1 || solidrev1)]},
Initialization :> (curve2low =
ParametricPlot3D[{x, 0, .15 Cos[2 x + 1] + .5}, {x, .5, 4.5},
PlotStyle -> {Black, AbsoluteThickness[1.75]}];
curverev1 =
ParametricPlot3D[{x, 0, .25 Sin[2 x + 1] + 1}, {x, .5, 4.5},
PlotStyle -> {Black, AbsoluteThickness[1.75]}]),
SaveDefinitions -> True, AutorunSequencing -> {2, 4}]
|
