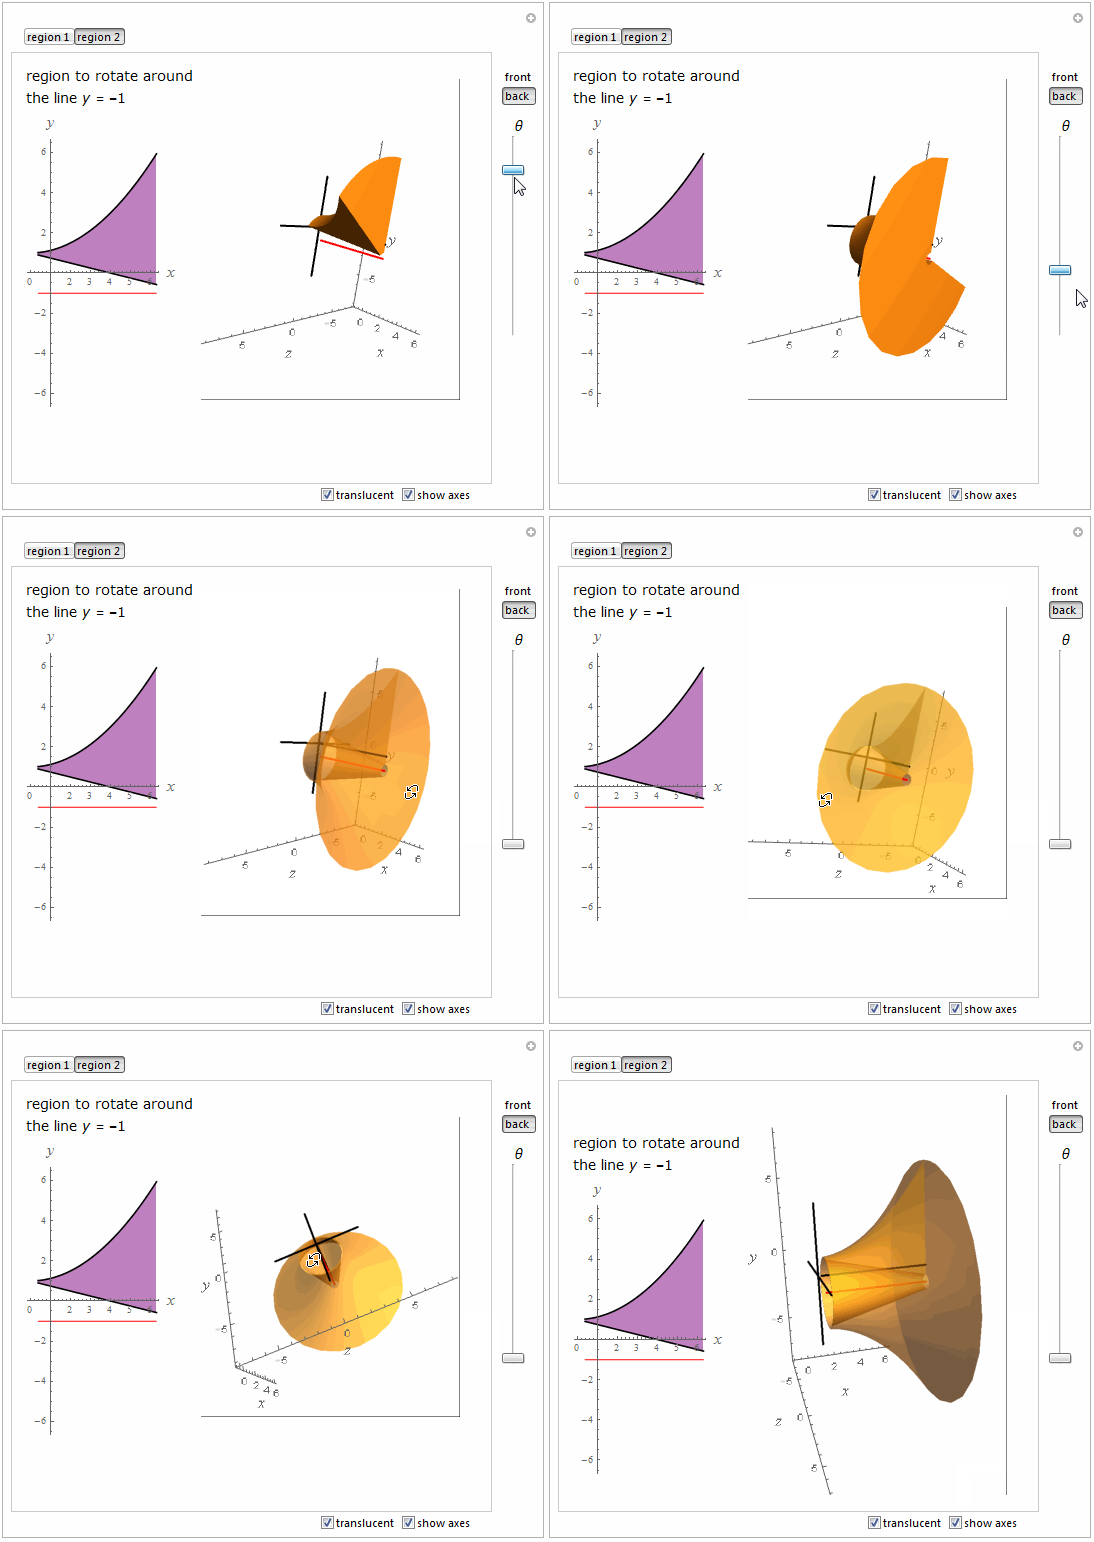

=================================================================
Manipulate[Pane[
Switch[fcns,
reg1,
f[x_] := 2 Sin[x] + 4;
g[x_] := x/4,
reg2,
f[x_] := x^2/8 + 1;
g[x_] := -x/4 + 1
];
yrotate = -1;
xmin = Pi/8;
xmax = 2 Pi;
ymax = 8;
ymin = -ymax;
$$viewangle = theview; (* 1: Front, 2: Back *)
viewlist = Part[{{0.5, 0.5, 1.5}, {0.5, 0.5, -1.5}}, $$viewangle];
activestyle = {PlotPoints -> 16, MaxRecursion -> 0, Mesh -> False};
inactivestyle = {PlotPoints -> 25, MaxRecursion -> 1, Mesh -> False,
PlotStyle ->
If[MemberQ[plotopts, translucent], Opacity[0.5], Opacity[1]]};
outsidesurface[thetamax_, opts___] :=
ParametricPlot3D[{u, (f[u] - yrotate) Cos[v] +
yrotate, (f[u] - yrotate) Sin[v]}, {u, xmin, xmax}, {v, 0,
thetamax}, opts];
insidesurface[thetamax_, opts___] :=
ParametricPlot3D[{u, (g[u] - yrotate) Cos[v] +
yrotate, (g[u] - yrotate) Sin[v]}, {u, xmin, xmax}, {v, 0,
thetamax}, opts];
a = xmin; b = xmax;
endmin[thetamax_, opts___] :=
If[Min[f[a] - yrotate, g[a] - yrotate] ==
Max[f[a] - yrotate, g[a] - yrotate], {},
ParametricPlot3D[{a, r Cos[t] + yrotate, r Sin[t]}, {r,
Min[f[a] - yrotate, g[a] - yrotate],
Max[f[a] - yrotate, g[a] - yrotate]}, {t, 0,
thetamax}, opts]];
endmax[thetamax_, opts___] :=
If[Min[f[b] - yrotate, g[b] - yrotate] ==
Max[f[b] - yrotate, g[b] - yrotate], {},
ParametricPlot3D[{b, r Cos[t] + yrotate, r Sin[t]}, {r,
Min[f[b] - yrotate, g[b] - yrotate],
Max[f[b] - yrotate, g[b] - yrotate]}, {t, 0,
thetamax}, opts]];
startregion[opts___] :=
ParametricPlot3D[{x, ((g[x] - f[x]) t + f[x]), 0}, {x, xmin,
xmax}, {t, 0, 1}, opts];
(* Rotating Region *)
rotatingregion[thetamax_, opts___] := Module[{},
startlist = {x, ((g[x] - f[x]) t + f[x]) - yrotate, 0};
rotmatrix = {{1, 0, 0}, {0, Cos[thetamax], -Sin[thetamax]}, {0,
Sin[thetamax], Cos[thetamax]}};
plotlist = rotmatrix.startlist;
region =
ParametricPlot3D[{plotlist[[1]], plotlist[[2]] + yrotate,
plotlist[[3]]}, {x, xmin, xmax}, {t, 0, 1}, opts]
];
ThreeAxes =
ParametricPlot3D[{{xmax*t + xmin/2 (1 - t), 0, 0}, {0,
ymax/2*t + ymin/2 (1 - t), 0}, {0, 0,
ymax/2*t + ymin/2 (1 - t)}}, {t, 0, 1}, PlotStyle -> Black];
revaxis =
ParametricPlot3D[{t, yrotate, 0}, {t, xmin, xmax},
PlotStyle -> Red];
regionplot = Show[
Plot[{f[x], g[x]}, {x, a, b}, PlotStyle -> Black, Filling -> True,
FillingStyle -> Lighter[Purple, 0.5]],
Graphics[{Red, Line[{{a, yrotate}, {b, yrotate}}]}],
AspectRatio -> Automatic, ImageSize -> 150,
AxesLabel -> {Text@Style["x", 16, Italic],
Text@Style["y", 16, Italic]}, PlotRange -> {-6, 6}];
Grid[{{
Deploy[
Column[{Text@Style["region to rotate around", "Label", 14],
Text@Style[Row[{"the line ", Style[y, Italic], " = -1"}],
"Label", 14],
regionplot
}]],
Show[
If[th ==
0, {}, {outsidesurface[th,
ControlActive[activestyle, inactivestyle]],
insidesurface[th, ControlActive[activestyle, inactivestyle]],
endmin[th, ControlActive[activestyle, inactivestyle]],
endmax[th, ControlActive[activestyle, inactivestyle]]}],
startregion[ControlActive[activestyle, inactivestyle]],
rotatingregion[th, ControlActive[activestyle, inactivestyle]],
If[MemberQ[plotopts, showaxes], {ThreeAxes, revaxis}, {}],
Axes -> MemberQ[plotopts, showaxes],
PlotRange -> {{-1, xmax}, {ymin, ymax}, {ymin, ymax}},
Boxed -> False, AxesEdge -> {{-1, -1}, {-1, -1}, {-1, -1}},
ViewVertical -> {0, 1, 0}, ViewPoint -> viewlist,
AxesLabel -> {Text@Style["x", 16, Italic],
Text@Style["y", 16, Italic], Text@Style["z", 16, Italic]},
ImageSize -> 258]
}}], ImageSize -> {450, 400}],
{{fcns, reg1, ""}, {reg1 -> "region 1", reg2 -> "region 2"},
ControlPlacement -> Top},
{{plotopts, {translucent, showaxes}, Spacer[295]}, {translucent,
showaxes -> "show axes"}, ControlPlacement -> Bottom,
ControlType -> CheckboxBar},
"",
{{theview, 1, ""}, {1 -> "front", 2 -> "back"},
ControlPlacement -> Right, Appearance -> "Vertical"},
"",
Style[" \[Theta]", 14],
{{th, 0, ""}, 2 Pi, 0, ControlType -> VerticalSlider,
ControlPlacement -> Right},
ControlPlacement -> Right,
TrackedSymbols :> {th, plotopts, theview, fcns},
AutorunSequencing -> {3, 4}]
|
